
Throughout 2020 market landscapes have been changing, audience behaviour has shifted greatly, and as a business there’s a lot of information out there that can help you understand this behaviour to drive more leads, sales, sign-ups etc.
The tips in this guide focus on understanding user behaviour across your site, many businesses have seen a complete shift in their audience and conversion behaviours. Without a firm grasp on the data many businesses are missing out on large opportunities to drive revenue and prepare for growth post-lockdown.
1. Understand demand shifts
Lockdowns across the world have changed demand across almost every industry.
To understand the demand of your own products a really easy method is to utilise Google Trends. Within this tool you can compare the popularity of products you sell, services you’re thinking of offering, or informational searches users are making. The data points go back 5 years, and can give insight into whether you’re offering users what they are currently interested in.
2. Changing demographics
The change in demand for products has also led to a shift in demographics for many businesses. The first step to understanding this shift can be found in Google Analytics within the demographics report.
Compare your audience age or gender year on year/pre vs. post lockdown to work out how your audience is changing. You may learn that you have a new converting user base, and decisions can be made on how to best target them.
3. Post-lockdown offers & testing
If you have brick and mortar stores that you’re not able to operate during lockdown, use this time to understand what drives user conversions across your site with testing. Develop post-lockdown offers then A/B test these in paid ad messaging, on-site through the use of Google Optimise or other CRO platforms, or in organic meta data.
Use the data previously gathered on your audience from the demand and demographic shift sections to make assumptions or hypothesis based on data, then come to a data-lead conclusion.
If you’re looking to get a strong understanding of your new audience base, Found’s social listening service can help to understand key conversion drivers based on data mining from social platforms.
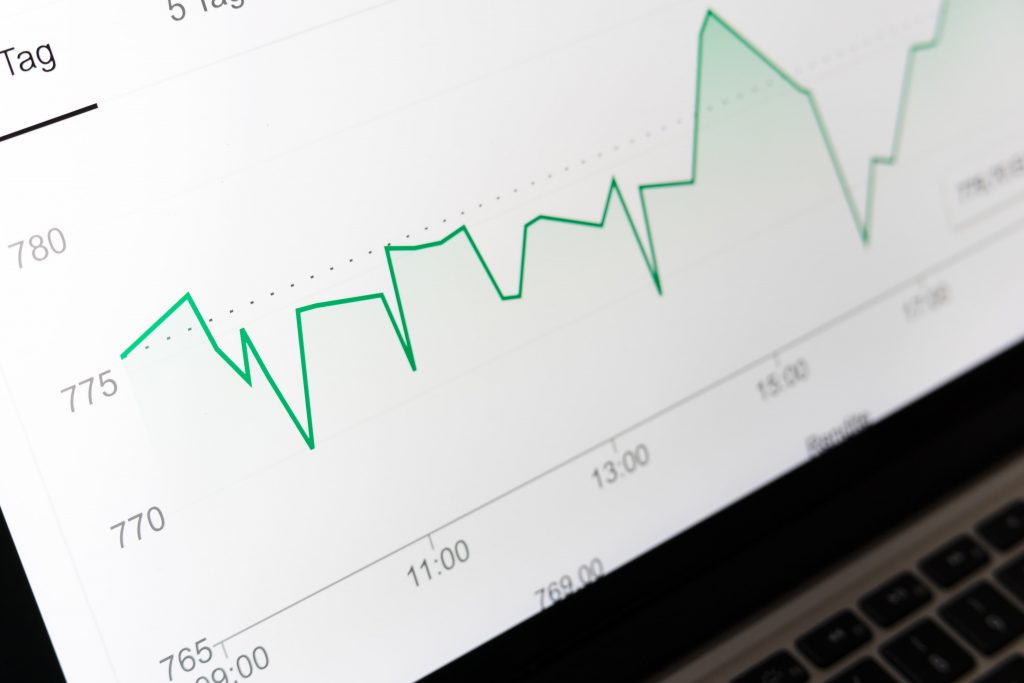
4. Create dashboards
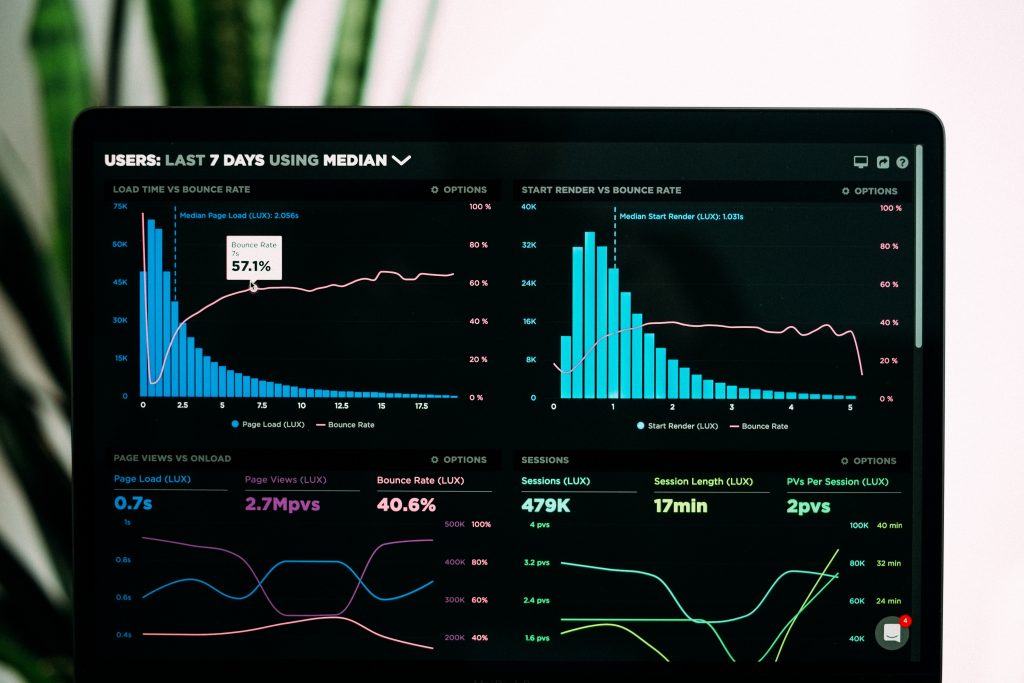
Everything can change within a day; this unpredictability means we must be more vigilant across our data set.
Simple dashboards tracking sessions, conversion rates, user behaviour metrics, demographics, and other KPIs can be set up in Google Data Studio. This will provide your business with a daily view of performance that can help to make decisions to keep the flow of revenue as stable as possible in turbulent times.
The data to help your business succeed in challenging times is available across analytics platforms. Understanding where to start can be difficult, hopefully the tips in this guide can help you make the first step. If you have questions around how you can leverage the data available to you to increase performance across your digital channels, get in touch with Found.