
The COVID-19 situation has revealed a striking concern in the data community: analysis in a vacuum. Many data analysts are weighing in on the pandemic in their free time, be it for the endeavour of mastering a new machine learning framework or mining Reddit /r/dataisbeautiful karma. Without domain knowledge, insider knowledge and, for lack of a better word, experience in industry, analysis is blind. This fosters a danger of false positives and inaccurate conclusions. The even more dangerous thing is that a powerful chart or a sophisticated analysis has the power to add legitimate backing to bad analysis. In aid of this crisis and for the purpose of restoring integrity to the data community here are five lessons I’ve learned from COVID-19.
Lesson 1: Blind leading the blind.
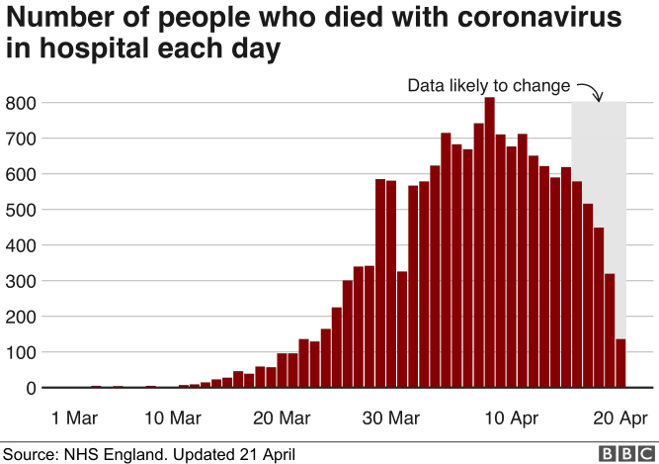
One of the strongest examples of how lack of industry knowledge is a bad recipe for data-driven decisions is a BBC News article explaining the five tests that need to be passed in order to ease lockdown restrictions. Test two of five looks for a “sustained and consistent” fall in the daily death rate. At the time of publication it looked like the number of hospital deaths was slowing down. Good sign! However, a more recent (at the time) analysis suggested that the peak may have already passed two weeks prior. This misconception was a result of a lack of knowledge around the data being analysed, especially the very specific information around features in the data sets. It turns out that the data showed when deaths were recorded not when they actually happened. The false assumption about the real meaning of this date variable in the data is reality-bending with implications on peoples’ quality of life.
There are no shortcuts. I think this quote from data science legend Hadley Wickham says it best, explaining how important getting to know your data is:
“That’s one of the things that really irritates me. I think it’s easy to go from ‘data cleaning” to ‘Well, you’ve got a data cleaning problem, you should hire a data janitor to take care of it.’ And it’s not this ‘janitorial’ thing. Actually cleaning your data is when you’re getting to know it intimately. That’s not something you can hand off to someone else. It’s an absolutely critical part of the data science process.”
Lesson 2: Data is king now.
Above is a video of a recent government press conference centred almost exclusively around data.
Remember when “content is king” was a thing? A mere royal servant in comparison to data now.
There are now entire press conferences dedicated to talking about data. This was not the norm before.
Peoples’ and the media’s focus are shifting. Data is becoming the bedrock of policy making in government. Data-led decision making is at the forefront of this crisis and has captured the attention of the world. Everybody is looking at the data every day.
Lesson 3: Numbers can be dangerous.
Now that data is king, that makes numbers a lot more dangerous.
Yes, there are conspiracy theories that the current pandemic is an antisemitic bioengineered Chinese spy operation but what I’m actually referring to is manipulation of numbers.
There is a lot of false information out there. This is by no means exclusive to COVID-19 but given the recent public focus on data, the crisis certainly highlights this fact.
Ethics pending, we can pretty much make numbers tell any story we want. And because of this, obscuring and being purposely selective with data in the name of a cool statistic is dangerously easy. However, we are now heading into a world where people will want to see that data and dig out the truth from underneath it.
To illustrate this I have a few examples of how data and insight has been obscured in the news to back up an agenda rather than disseminate unbiased information.
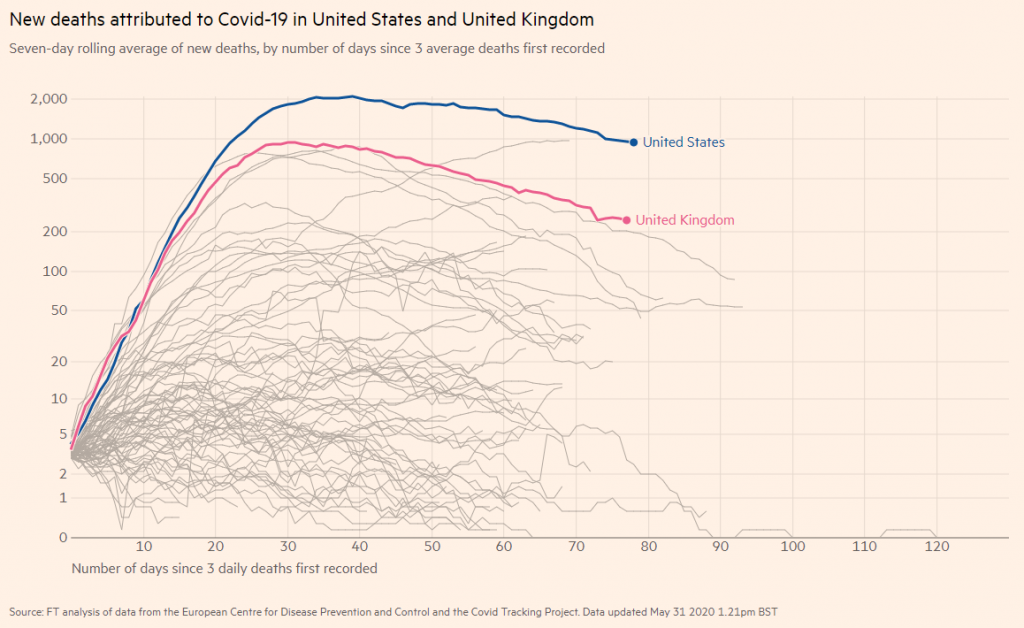
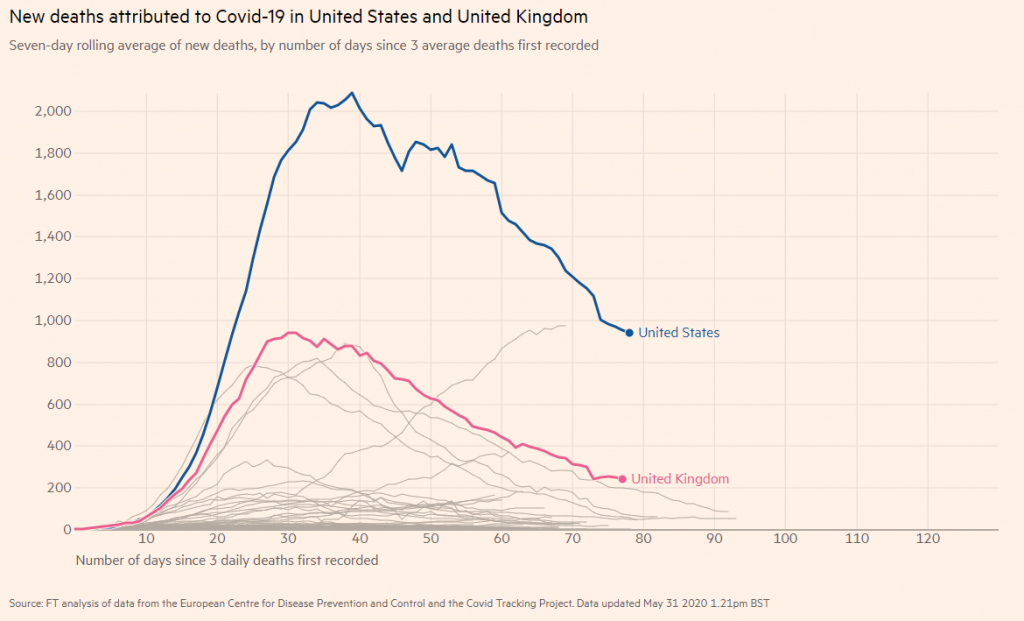
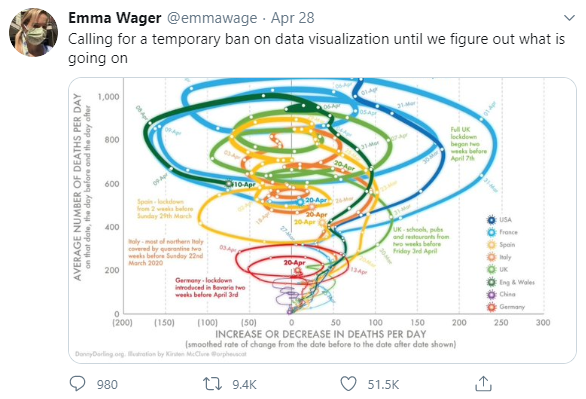
Firstly, logarithmic scales. They have their place, and it’s not morning news channels. Yet the mass media consistently portray COVID-19 insight through logarithmic graphs.
Logarithmic scales are used all the time but you probably don’t even notice it. That’s intentional. Log scales are really useful for illustrating trends but they sorely misrepresent the magnitude of a situation. Have a look at the difference between these two charts showing exactly the same data.
Secondly, let’s talk about projections. Predictions about the future made by machine learning algorithms should always acknowledge their uncertainty, which they rarely ever do in the media. Statistical models can do a good job at predicting the future but even the most cutting edge AI is not able to predict anything with 100% certainty. We should know with how much confidence we can believe any analyst’s predictions. For example, there was an instance of a US company predicting 66K UK deaths but that fell to 37K just three days later.
Misinformation is for the express and nefarious purpose of telling the story you want to tell regardless of what the data around you is saying.
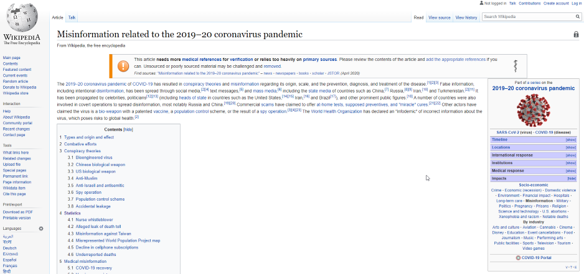
Back to my favourite Wikipedia page. If you scroll further down the page you’ll find something amazing.

If this is true then Resident Evil is real and that is both terrifying and amazing.
Lesson 4: We can disarm data.
When data becomes less dangerous is when more people have eyes on it and everybody is allowed to see it and interrogate it. This is when it becomes open source.
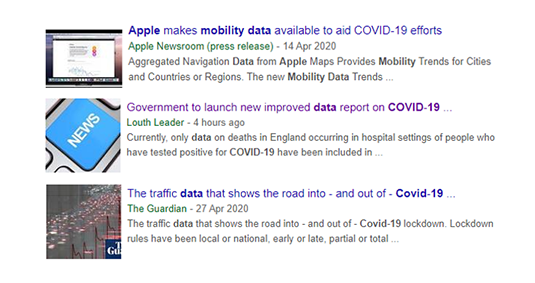
Data from various sources that we thought would never mesh is being stitched together to tell a rich data story. We’re seeing a lot more collaboration between big tech players like Apple and Google, and National Statistics offices. We’re seeing work between the United Nations Statistics Division (UNSD) to share knowledge between national statistics offices to ensure that decision makers have the data they need to defeat the virus.
We’ve even seen Google and Apple working together to develop a contact-tracing mobile app. That is like when Undertaker and Kane put their differences aside to team up as the Brothers of Destruction to win the Tag Team championship, except not as awesome.

This open sourcing of data has shown the added benefit of revealing weaknesses in our global data infrastructure, maybe things we never really thought about before. For example, digital gaps in nursing homes in the UK.
Lesson 5: A new data dawn
A lot of data being stitched together but will it always be a good thing? How will this affect policy making in the future, in a post-COVID society? What might the next pandemic look like? With the fusion of big tech and state surveillance, will we see a shift in surveillance operations? People should hold governments accountable for their partnerships with big for-profit tech companies, such as the data they get from mobile phones (e.g. GPS).
This concern is not too distant from how the public’s perception of the privacy of their data and how it was being mined for marketing purposes sparked the GDPR saga. It all comes back to responsible data use. It is very cool how all this data is being exposed, analysed and spoken about in the public domain but it’s more important to make sure we’re using it in the right way and doing the right thing.
To Close Out…
In summary:
- Be agile in response to fluid insight
- More attention is being paid to data
- Never accept a statistic at face value especially if you saw it on the news
- Data becomes more sturdy and more reliable when it’s fully transparent
- We have a responsibility to hold government and institutions accountable for our personal data
To make conclusions from data we need to really know data and be able to change as it changes. More eyes are on data than ever before, which means data has more power and that makes it more dangerous. But we have the power to disarm it by sharing and being open. We’re sitting on the brink of a new data dawn; how we hold institutions accountable and how mindful we are of it will play a large part in the role of data in our lives.