
We are excited to announce that Found is Google Data Studio certified! To mark this prestigious event we’ve prepared some useful micro-guides to help you master Google Data Studio.
Data Studio can do more for you than simply revamp stale GA dashboards. This is not an introduction to Data Studio. While documentation is still a little light and most DS guides are introductory this is for the analysts who want to combine their skills and curiosity with Google’s latest free and unlimited tool. For fellow R-obsessed cultists, I leave some useful code here and there but this article will be useful even if you don’t code. This is an article full of micro-guides for doing cool shit in Data Studio. Micro-guides are even smaller and even more digestible that mini-guides. If you thought nifty filter controls were enough to impress your boss, think again – that’s middle-of-the-road stuff. Let’s blow some freakin’ minds.
Google Analytics is only a starting point
“The average Internet user spends a staggering 81.31% of their time online scrolling through social media news feeds.” Wow.
I made that up. But I reckon it’s true. In any case, Facebook provide a wealth of information on the performance of your page(s) — a brilliant way to flesh out social metrics when you find insights are thin in GA.
Take the Facebook Graph API for example, which lets you download insights. Explore, see if you’re not tempted.
If you plan to write a programme or automate these insights, then you’ll need to swap your two-hour access token for a long-lived version. The official documentation tells you just how you can do that. Alternatively, for the useRs (i.e. if you use the ”R” programming language), grab a temporary access token from the Graph Explorer and run it through the snippet below. There’s also a package called “RFacebook”, which has several helpful functions for extracting insights data from the Facebook API.
extend_fb_access_token <- function(tmp_token){

  require(httr)

  query <- paste0(
    "https://graph.facebook.com/oauth/access_token?",
    "grant_type=fb_exchange_token&",
    "client_id=", {Your Facebook App ID}, "&",
    "client_secret=", {Your Facebook App Secret}, "&",
    "fb_exchange_token=", tmp_token
  )

  getdata <- GET(url = query)
  content <- rawToChar(getdata$content)

  long_life_token <- unlist(strsplit(content, "&|=", perl = TRUE))[2]
  expiry_date <- as.numeric(unlist(strsplit(content, "&|=", perl = TRUE))[4]) / (60 * 60 * 24)

  print(paste0("New token expires on: ", as.Date(getdata$date) + expiry_date))

  return(long_life_token)

}

long_life_token <- extend_fb_access_token({Your short-lived token})
Most analytics tools, be it Searchmetrics, Majestic SEO, HubSpot, AWR etc. have well documented APIs that can be used to unify all your data sources into one dashboard.
Getting it into data studio
DS has connectors that allow you to pull in data from a variety of sources. You know this. The two I find most versatile however are the Sheets and MySQL connectors. Both are great, both are free to use and can hold many types of data.
One advantage of Google Sheets is the Google Analytics add-on.
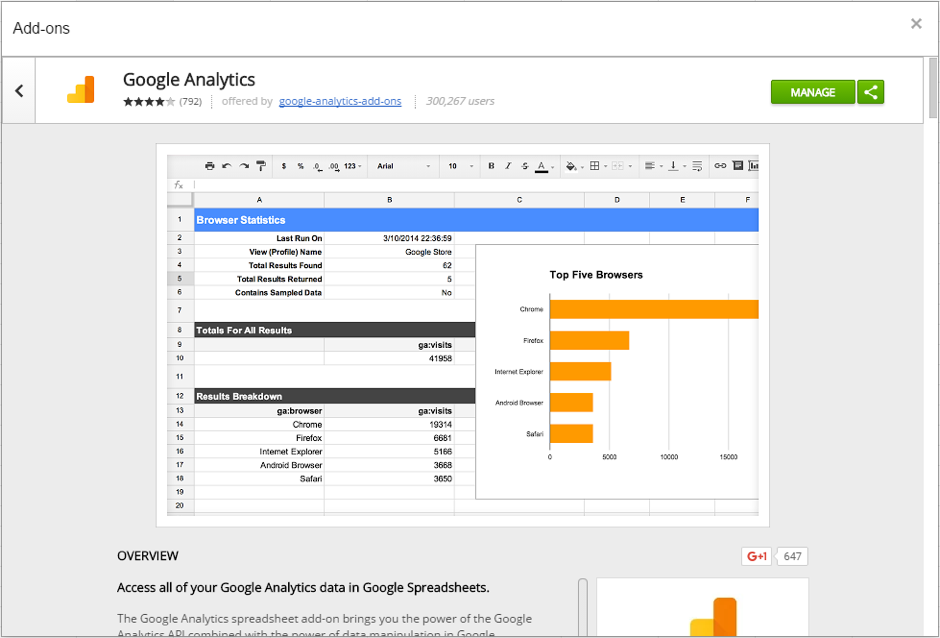
Create and schedule reports to run from the Analytics API so you can manipulate your data from multiple profiles. This is most helpful when you find your puppet strings are cut loose by Data Studio’s somewhat limited list of functions and documentation.
Google Sheets also has an API so you can easily automate insights or programmatically work with data from your preferred technology. If you’re using R, the “googlesheets” package will help you along this road. There are many examples for using this package in a digital marketing setting.
Equally this is useful in reverse. If you have colleagues/clients who are manually updating Forms or Sheets you can download it and process it however suits your business needs.
Alternatively, forget R. Forget programming! TO HELL WITH COMPUTERS. Okay too far. Using only Google Sheets, you can scrape Google Search results and then whip it straight into Data Studio. Here is an excellent walk-through on how to do that.
For storing large volumes of data, especially when routinely running analyses, I prefer to use MySQL. It’s relatively easy to use and is a reliable way to store and access your data in Data Studio.
Geo Maps
If your data source is not Google Analytics, AdWords or YouTube, then configuring a Geo Map can be tricky.
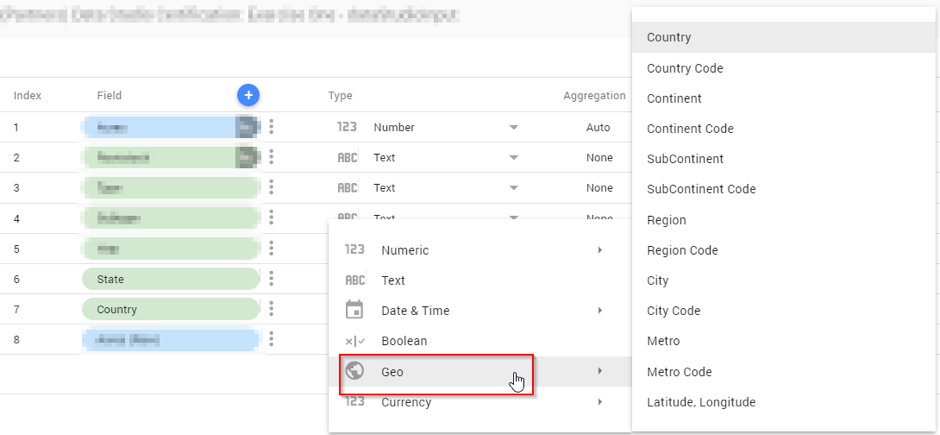
All that’s needed is for Data Studio to recognise the format of the location you are using. The Google Analytics dev guide has an interactive table which lists all available geographic targets. You can even download the entire table as a CSV to match it against your dataset.
Alternatively, we can use longitudes and latitudes for more precise geotargeting. This is particularly helpful for adding some jitter to high volumes of data points. R you ready for another code snippet? Here’s an example of how to use a very minimal amount of R code to easily geocode locations that might not be listed explicitly in the table. It’s pretty much the same as typing a location into Google Maps.
library(devtools)
devtools::install_github("dkahle/ggmap")

library(ggmap); library(tidyverse)

## Create data frame of places to geocode
towns <- c("Acton", "Maidenhead", "Immingham")
counties <- c("Greater London", "Berkshire", "Lincolnshire")
df <- data.frame(towns, counties)

## Get longitudes and latitudes
df_latlons <- df %>%
  mutate(
    lon = geocode(paste(towns, counties, "gb", sep = ", "), output = "latlon")[[1]],
    lat = geocode(paste(towns, counties, "gb", sep = ", "), output = "latlon")[[2]]
  )
Aggregating over longer time intervals
Often graphing a time series by day will produce a noisy interpretation of data. Provided your dates are formatted in a way DS recognises, it is possible to aggregate dates over longer time ranges, such as week, month, or year without modifying the underlying data using calculated fields. For example,
From YYYY-MM-DD to year-month:
![]()
Or to ISO week:
![]()
Google’s documentation will give you a lot more information on other date formats to suit your needs.
Where do we go from here?
If this post hasn’t blown anyone’s mind, then I have failed. But that’s only because we’re still missing several features that would take it to the next level.
Using code may rub against the grain of an easy-to-use and highly accessible dashboarding tool, however the ability to inject JavaScript would introduce a realm of new possibility from neat visualisations to calculations between different dashboard elements.
If not that, then for the love of Google grant us the power to join tables. Amen. If data sources could talk to each other, we could bring them together in such interesting ways.