
What do you measure in digital marketing? Is it all about revenue?
For every business, revenue is the bottom line. There are no two ways around it. To survive as a business, you need to make money. How that money is generated differs from business to business, whether it comes through advertising, selling products or services, or generating leads, the final question at the end of it all is “how much money did it make?”

Does this mean that every single thing you do as a business has to generate revenue? Probably not, right? You measure so many different things as a business: from what comes in to what goes out, even what comes in as a result of what goes out. So when it comes to measuring what matters, is it really all about revenue or are there other metrics you can look at to understand what you’re getting in return for your efforts?
Measuring what matters.
I wrote a post recently on what it really means when digital is responsible for the vast majority, if not all of your business efforts and how we should be measuring digital performance. That got me thinking about whether or not what is being measured is actually valuable and whether businesses are really focusing on the right things.
If you look back at most of the proposals you’ve sent out or pitched for, you’re probably going to find a couple of core performance measures in the mix that break down into:
- Traffic (visits to site)
- Return (leads, transactions, revenue)
But what about all of the other things people could do on your website? Where are those metrics? What could they add that these two don’t cover? And, most importantly, which matter?
In this post we’ll run through three things:
- Hard metrics
- Soft metrics
- Metrics that matter
For the hard metrics, I’ll discuss what you really need to be looking at, why they matter, and how you can use them to inform your marketing decisions. For the soft metrics, I’ll explain what they are and how you can derive insight from them. For the metrics that matter, I’ll run through how you can figure out what you need to be measuring.
But, first things first, you need to lock down a consistency for reporting so you’re not only looking at the same data all the time to spot the trends and changes, but you’re confident that data is accurate as well. To do that, ask yourself the following:
Reports:
- Are you looking at the same report in GA/GSC/Google
Ads etc. all the time? - Are you reporting
daily/weekly/monthly/quarterly/bi-annually/annually? - Are you annotating platforms as changes are
made? (GA, Rank trackers etc.) - Are you monitoring SERP feature changes? Trigger
changes? Measurement changes in platforms?
Accuracy:
- Are the channel groups/segments set up properly?
- Are goals tracking correctly?
- Are you using content groups to split the data?
- Are you tying up data in reporting platforms to
back end systems/live data?
Traffic Type:
- Is it all going to informational sections of the
site? Commercial? - Is it brand or generic?
- Is it coming and leaving rather than exploring?
- Engagers vs. Converters?
Once you’ve got answers to all of those, you can start working out how you want to be dissecting the data to make the most sense out of it, and start making decisions on what to do off the back of performance changes.
Measuring Hard Metrics.
How to Measure Traffic.
Almost any forecast ever done for a website has some form of traffic measure embedded into it, whether you’re using it as a standalone projection or as part of understanding the amount of conversions/revenue you can expect to drive.

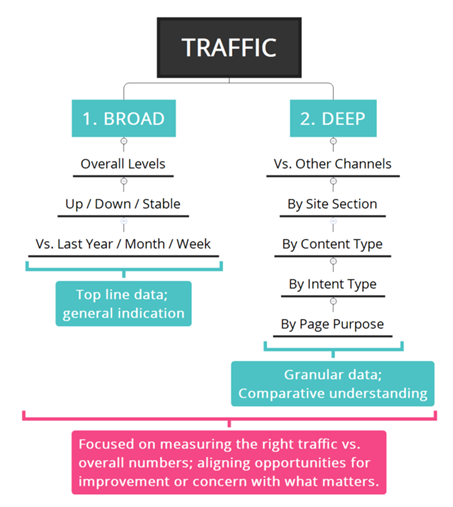
Traffic is essential. Measuring traffic is important. Being forecasted or targeted against traffic for a specific channel? Relatively useless. Why? Because everything changes all the time. And, shockingly, traffic comes from a huge variety of sources through very convoluted journeys, so just looking at it from a single-channel perspective doesn’t really reflect changes in traffic performance. It only reflects changes in that channel, which could be impacted by any number of things from SERP changes, to the economy.
So firstly, measure by channel and by overall, and then you’re already in a better position to understand what that traffic is doing.
Secondly, one of the biggest misunderstandings in measuring traffic comes from the assumption that if traffic is going up, you’re seeing improvements to the business. But really, if traffic is going up and not doing anything (i.e. not converting, not staying on the site, or not exploring other areas), then is it really adding value?
If you’re going to measure traffic alone as a performance metric, you need to be looking at it from (minimum) two angles to understand a) what is happening and b) whether it matters in the grand scheme of things.
Applying findings.
One of the best ways to apply this information is by looking at where on the site your traffic is going to and whether that is where you want it to be going.
If you’re seeing a lot of your traffic is going to informational content, but you want to encourage more visits to your commercial pages, you can undertake an internal linking exercise and make sure the content getting traffic clearly links through to related categories/products/services. Then go a step further and make sure those core commercial pages are getting the right weight on the website; if your informational content has more internal links pointing to it than your commercial content, find a way to shift that balance in favour of the core pages.
If you’re seeing a lot of your traffic is coming into a commercial page and bouncing off, its worth taking a look at your competitor’s pages to see if they are set up any differently and running a few heatmaps and tests on your own website to figure out what might be causing the drop-off.
The key to getting the most out of your traffic is running tests; whether that is from an advertising perspective to see what brings people through to the site, or from an experience perspective to see what people want when they get there.
How to Measure Return.
Return can generally be classified as the result of your activity. For the most part, people use Revenue as the measure, but some also look at Transactions and others Leads if they are more service-based companies. So slightly different measures but largely the same thing. If these are going up it is almost always a good thing for the business. But just knowing they are going up is no better than just knowing they are going down. You still need to know the why and any consequent impacts.

Why are they going up/down?
- Is the traffic being driven more/less engaged
than before? - Have you changed your forms/checkout process?
- Have you sped up the site?
- Have you updated your delivery policies?
- Have you changed the way your customer service
team handles requests? - Have you opened up new territories?
- Has the economy changed?
- Have user needs changed?
- Are you ranking higher/lower than you were
before? - Is
competition lower/higher than it was before (both SERP and service/product
related)
For anything going up, you need to also take a look at what impact that is having to make sure it isn’t a false-positive:
- Are you seeing more returns on products?
- Are the leads being generated more or less
qualified than before?
As with traffic, just looking at the top-line figures isn’t going to give you the information you need to understand where performance is coming from, or where you have more opportunity to improve. Knowing what is causing that change is going to be fundamental to what you do next.
Applying findings.
The quickest application is going to be building on where the success is coming from. If you’re seeing particular ad groups drive the bulk of return, see if you can up the budget for those. If you’re seeing particular landing pages perform better than others, look for why that might be – are they better optimised, do they have a better layout, is the copy better, the speed, etc. – and then look to apply that to other similar page types on the site.
But the biggest application is going to be working with your client to understand what the true impact is. If the way you measure return is going up but it isn’t adding value to the bottom line, either because products are being returned or the quality of leads is lower, then what you’re doing needs to change. Work with your client to plot the best course of action for resolving it. Trying to do it all by yourself, on just the data you have, is going to take far longer, and likely turn out to be far more expensive, than going to your client and working with them to apply their knowledge and act quickly and effectively.
But not every user who comes to your site is there to buy something or get a quote or even fill out a form, so what do you do with these users? Just leave them in their own little pocket of “non-engagement” and separate them from the rest of your traffic? Probably not, right? It’s probably worth getting to know these people a little better so you can give them more of what they came to you for.
Measuring Soft Metrics.
Think about how many interactions a user could have on your website, and how many different journeys there are through it. If all you’re doing is looking at the people who meet your conversion criteria, or come to the site from the right place, what happens to all of the other people who don’t “convert” but make up the vast majority of your traffic?
You still need to find a way to understand who they are and what they are doing, especially when that isn’t what you think they should be coming to the site for. If they aren’t completing your desired conversions, you need to be measuring other things as well.
How to Measure Engagement.
Engagement is particularly important to measure for informational content, but that doesn’t mean you’re only looking at bounce rate. Bounce rate at the best of times is a highly contentious metric because a good bounce rate could be high or low depending how you look at it. There are multiple other factors to look at for engagement, from things like dwell time right through to the how
long that content is likely to perform for[i1] , which are going to give you better insight.

Whenever we do a content audit at Found, we look at performance and engagement as two separate metrics. Performance is based on things like sessions and conversions, with engagement being based on things like average session duration and pages per session. We’ll look at from both an overall standpoint and a by-channel assessment, drilling into the individual channel performance for different informational sections of the site.
Why do we do that? To understand how engagement differs between various sections and various channels. If, for example, you know one section of your site has much shorter list-based content and another section has more detailed guide-based content, engagement is going to be very different between the two. Then if you look at the engagement from Organic Search vs. Paid Search vs. Social you’ll start seeing how different channels engage with different content types, and from there you can start forming a plan for what content needs to be created for which channels.
If you just look at the standard performance metrics then you’ll more often than not see the informational sections of your site “don’t work” and therefore don’t deserve a high level of future investment. But understanding how traffic is engaging with those sections is a key part of a proper digital strategy.
True, measuring engagement comes down to softer metrics than things like Return, but it will indirectly help you understand more about what your users need, and therefore what they need from you before they convert. Measuring engagement isn’t about identifying changes in performance, it’s about identifying opportunities for improvement based on what’s working already, including:
- How far down the page they scroll
- How long they spend on the content vs. the
estimated time it would take to read fully - Where they go next, or whether they leave the
site - Whether they look for any additional actions to
take – internal links, CTAs, downloads, phone numbers
A lot of this can be measured in Google Analytics with events and custom dimensions, but you can, and should, have heatmapping software deployed wherever possible to understand the interactions users take when they arrive at the page. Which leads quite nicely onto understanding behaviour.
How to Measure Behaviour.
Heatmaps will tell you an awful lot about how different people use your website, and you can look at it from an overall perspective, or drill down into individual journeys. The behavioural analysis part of this measurement is imperative to understanding what you need to change to get to the desired outcome – i.e. better Return. But behavioural analysis doesn’t fall into a performance measure, and doesn’t really fit into engagement, so why should you be looking at it?
The more you can learn about journeys from heatmapping tools and the flow reports in GA, the more you’re going to be prepared when someone doesn’t follow that journey. And the more prepared you are for that, the easier it’s going to be to determine what the pain points are in different journeys that would stop a user completing a desired action.
The biggest advantage to behavioural analysis is learning about different journeys and the different actions people take. This is particularly important when comparing the different sections of your site. Treat behavioural analysis as you would any other test – create a hypothesis, evaluate what happens, then determine next steps and implement.
But measuring behaviour doesn’t stop at understanding how people move through your website, that’s just the start. To really understand behaviour, you need to be looking at all of the touchpoints before reaching your website in the first place, and what they do afterwards. That can be done through a series of attribution models, custom events, and third-party tools, but also relies heavily on you speaking to other channel teams and your clients to get as much of a story behind the behaviour as possible.

Many companies now have audience personas, and there are tools out there that will help you build a picture of your audience and what their needs and desires are, but just because a persona is in place doesn’t mean that it a) matches your entire audience base, or b) is never going to change. If your audience changes, or their needs change, you need to know what those changes are and how that impacts your business and your activity. It could lead to a change in channel split, or strategic direction, or even service offering, and all of that starts with understanding the behaviours of people on your site and how those change.
How to Measure Goals.
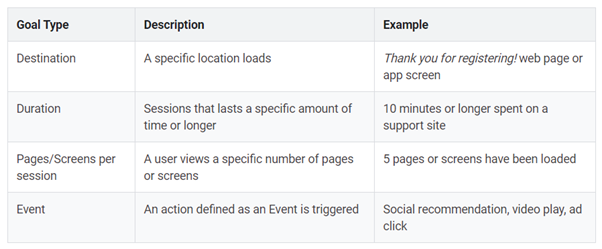
Goals is a fun one, because they can be almost anything you want them to be. There are 4 main types you can use in GA, but you can only have 20 set up and tracking at a time:
I know, how on earth do you have 20 different things you want to track? Oh wait, no. Why on earth would you not track as much as physically possible?
Time and time again I see Analytics profiles with fewer than 5 goals set up and while there is nothing wrong with that it does make me question how much deeper we could go. Most of the time, these goals are all tied to harder conversion metrics, and almost always are set up for leads – phone calls, live chats, contact forms, emails – but rarely do goals get set up on Duration or Pages per Session types. Destination and Event goals are the most frequent types you’ll see because they rely on a user completing an action and so are much easier to think of and implement.
But Duration goals tie in so much more than just whether someone clicks the right button. They look at things like whether people are spending the right amount of time on your content, whether people read your information before enquiring, whether people watch your webinar, or your video, or just share it.
Destination Goals
These are great for understanding actions users are taking when they land on another URL as a result. For example, a user fills in a form and gets taken to a /thank-you page. If you have downloadable content – guides, factsheets, whitepapers, resources – these should be set up so you can measure interaction across different download types as well as the pages on which the downloads occur.
Duration Goals
These are ideal enhancements to your engagement measurements, based on triggering when a user has spent over a certain amount of time on the site. These are great for drilling into engagement by different channels, e.g. understanding how many users from Paid Search spend over 5 minutes on the site vs. Organic Search vs. Direct etc. We know that different channels generally have different intents and so different requirements on the site, but the more we can understand the differences between them the easier we can adapt to suit them.
Event Goals
Event goals are based on a user taking an action, similar to destination goals, but that do not require the user be taken to a new URL. For example, that could be clicking on a button that opens a popup form, plays a video, or connects to a social share or email.
These are particularly good for understanding where on a page a user is clicking and whether that is where you want them to be. Event Goals are basically the foundation of layout-based A/B tests – if you move a button here, does it get clicked more or less than before? Without event tracking, you’re not going to know what users are clicking or where on the page that is, so really, they’re quite essential to understanding behaviour.
Pages Per Session Goals
Want to track what percentage of your users visit multiple pages on your site in a session? No? So you don’t want to know which entry points drive the best on-site engagement?
This type of goal is so underused, and in my opinion so underrated, because everyone falls into the trap that this isn’t a direct performance indicator. If you know what type of pages encourage people to click through to other areas of the site, you know more about what people want to find from you. Combine that with other goal types and behavioural analysis and you’ve got a solid foundation for understanding how you encourage those people to the areas of your site you “actually care about” – the conversion points.
Measuring What Matters.
Return is always going to matter, regardless of what channel you’re responsible for or what requirement you need to fulfil. But return isn’t everything, and we need to move away from just looking at the hard metrics and starting to look at the softer ones that contribute to them.
But just because you can measure everything doesn’t necessarily mean you should. I am all for having as much data as possible before making a decision, but only when that data is applicable to what I’m looking at. Nobody wants to have to sift through line after line of irrelevant information to find the one snippet that matters. The real trick is understanding what matters to your clients and what you can impact from your activity.
Generally, you can look at measurement in three sets:
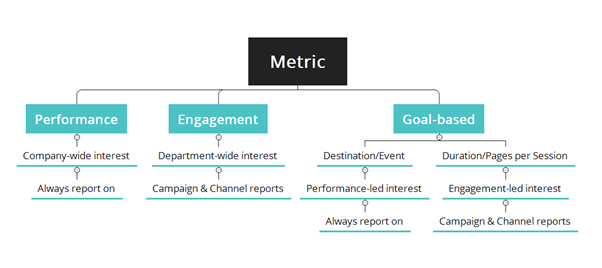
Traffic and Return are always going to be metrics that senior stakeholders look at, so you’re always going to need to report on them, as you should. But for each you’re going to need to go deeper than top-line to understand the value they’re bringing to your clients, and with that you’ll instantly be offering more value to the senior stakeholders and be able to guide them through more valuable decisions.
Engagement metrics are going to be far more important for different teams in the business, like the Content teams, Web teams, or Creative teams. These teams care what people are doing on their website so if you’re working closely with them, either as part of your normal work or for a specific campaign, you need to work with them to understand how to measure engagement. Whether that is through heatmapping or custom events, get the measurements deployed and work with them to derive insight. Any piece of content that is created should have a level of engagement measurement tied to it so you can see whether it works or not.
Goals are going to be far more important at a campaign level. If you’re launching a specific campaign, or a new landing page, you’re going to need to know how that stacks up to other pages even if it is not a direct type match for an existing page. If you need to be looking at whether a new campaign is driving more leads than previous ones, make sure destination goals are tracked. If you need to know that people are watching your latest webinar so you can plan in more similar content, get duration goals set up ready for launch. If you’re testing layouts, get event goals set up to track where on the page a button is clicked. If you’re creating a new user journey through the site, get pages per session goals set up and track alongside the behaviour flow.
In Summary.
Revenue is and always will be the bottom line performance metric for a business, but only looking at revenue will not give you all the information you need about how you can improve your performance. If you’re only measuring your website by how many people buy something on it, you’re not looking at why the rest of your users aren’t.
Everything you do as a business will ultimately be to drive revenue, but not everyone who comes to your site is ready to buy from you. You need to nurture them, convince them that you’re the best choice, and prove to them why you were, and you cannot do that from just looking at revenue and saying “we’re up 15% on last month”.
You need to measure everything that is important to your teams, and everything that might matter to your users. If your content team want to know more about what content people engage with so they can create more of it, get it set up. If your PPC team want to know more about where people are going after they’ve clicked through from their ads so they can adapt their messaging, get it set up. If your SEO team want to know where on the page people are scrolling to so they can make sure the most important links are above that point, get it set up.
Everything still leads back to revenue, but what you measure and implement along the way will be what sets you apart.

