
Google has updated their timelines for the rollout of the Core Web Vitals forming part of the Search algorithm. Instead of May 2021, the rollout will now begin from mid-June.
In this update, they have also announced the rollout will be gradual and that page experience won’t play its full role as part of the ranking systems until the end of August.
What is confirmed for the rollout?
According to Google, when the rollout begins, “the page experience update will consider several page experience signals” which includes:
- Core Web Vitals (LCP, FID, CLS, and Chrome’s recent fix to CLS)
- Top Stories carousel on Google Search will include all news content providing it meets the Google News policies – AMP format is no longer required
- Similar updates to the Google News app – expanding usage of non-AMP content
- No longer show the AMP badge icon to identify AMP content
Back in December, we could see early signs of a test which would provide a visual indicator to highlight pages with a great experience in the search results. This hasn’t been mentioned in the latest announcement, so it is unclear whether this will be rolled out but during testing it looked like this:

It was said if the test was successful it would be incorporated into the rollout.
Although the rollout timeline has moved, the inclusions of the rollout haven’t changed drastically. With that in mind, we take a look at what the Core Web Vitals specifically mean for SEO and the activity you need to be focusing on right now, including:
- An overview of the Core Web Vitals
- How to review
- Tools you can use
- Use cases
- Getting ahead
An Overview of the Core Web Vitals
The Core Web Vitals consist of three metrics:
- Largest Contentful Paint (LCP) – measuring
loading performance - First Input Delay (FID) – measuring
interactivity - Cumulative Layout Shift (CLS) – measuring visual
stability
These are all metrics which have previously been available through other tools such as PageSpeed Insights and are powered by the Chrome User Experience Report (CrUX), but having them directly accessible in GSC opens up a few new opportunities. Alongside these three Core metrics, there are other “supplemental metrics” which capture a larger part of the experience and are used to help diagnose issues with the Core Web Vitals:
- Time to First Byte (TTFB) & First Contentful
Paint (FCP) – diagnose issues with LCP - Total Blocking Time (TBT) and Time to
Interactive (TTI) – diagnose issues with interactivity
The other point to note is that although these metrics are all available now, they still have room to grow and develop as more and more data becomes available. This is key for understanding whether the benchmark will move in the future and, right now, it doesn’t look like it will.
Benchmarks across each metric can be seen in the image below for what constitutes a “Good”, “Needs Improvement” and “Poor” URL:
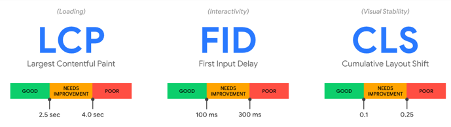
The aim at the moment is to have your URLs in the 75th percentile of page loads across each of the Core metrics and desktop and mobile. But, if they were to add a 4th metric into the Core metrics, it is likely you would still need to be in the 75th percentile but across more metrics.
Digging a little bit deeper, the 75th percentile was chosen so that a majority of visits to the site experienced the target level of performance or better, while being less affected by outliers. There is a huge amount of information on the criteria for these metrics and making sure they are achievable in this post, which are both extremely valuable sets to work from. For example, for a threshold to be achievable they require at least 10% of origins to meet the “good” threshold, and then also ensure that well-optimised content consistently meets the “good” threshold to avoid misclassification due to variability. The same post also breaks down the % of CrUX origins classified as “good” and “poor” for each of the metrics, which are then used as the thresholds seen in the image earlier:
- LCP:
- Good: 2.5 seconds
- Poor: 4 seconds
- FID:
- Good: 100ms
- Poor: 300ms
- CLS:
- Good: 0.1
- Poor: 0.25
How to review Core Web Vitals
- Crawl the site using Screaming Frog with PageSpeed Insights API access connected
- Categorise the pages by type so performance can be analysed on a template level – blog, category, product, ancillary, etc.
- At a template level, cross-reference speed against Chrome User Experience report to get real world data – you can use DataStudio for this as well!
- Identify whether each page/set of pages passes or fails the CWV against the three metrics
- Review origin/domain level data as well as key page types – gives you an overview as a benchmark to check against later
- Benchmark against your competitors! Use the same process to determine where you sit in relation to your key competitors
- Monitor progress over time using a variation of the CrUX dashboard
This process will help you understand your site performance at scale, but it is worth keeping in mind that if you are operating on a headless website, PageSpeed insights is likely to give you inaccurate information so you will need to do some more manual digging to assess performance fully.
Tools to assess Core Web Vitals
For any review, we strongly recommend using a variety of tools to test and benchmark, cross-referencing performance scores from each to take an average score and making sure you’re using real-world data wherever possible. For us, that means using any mixture of:
• PageSpeed insights
• Lighthouse (Chrome Dev Tools)
• Chrome User Experience Reports
• Google Analytics speed reports
• WebPage Test
• Google Search Console
Keep a note of which tools you use so you can easily replicate the analysis when it comes to reviewing implementation. When you are conducting a review, it is important to do so with as few additional features operating as possible. That means clearing your cookies, running checks in incognito, and making sure any extensions you’re using are disabled to get as close to accurate data as possible.
Use Cases for the Core Web Vitals
One of the biggest use cases has got to be bulk reports. Being able to drill directly into the Mobile performance of Poor URLs by specific issue, and then see the number of similar URLs affected by the same issue is a huge time saver, and great for prioritising which sections to look at first. Before, you’d have had to do a fair bit of that manually. Further examples include:
Assessment:
- Quickly compare mobile vs. desktop performance
- Assess changes in performance over time
- Identify
problem metrics
Analysis:
- Track
Web Vitals data in Google Analytics (Core and Other) - Analyse impact of Web Vitals performance on
conversions - Analyse impact on scroll depth/on-page
engagement
Prioritisation:
- Identify problem “sections” of the site through
the “similar URLs” grouping - Identify focus areas from an optimisation
perspective at scale - Combine with Mobile Usability issues to
prioritise areas of the site
But the use cases don’t stop at just the Core Web Vitals. We know that supplemental metrics are also being used, so utilising tools that pull those (CrUX, PageSpeed Insights) to pull the broader spectrum of factors will give you a greater base to work from for any of the above three areas.
Getting Ahead
With the announcement that the Core Web Vitals will be in play from mid-June 2021, there is work to be done now to get ahead of the competition and make sure you’re not only not affected, but are in prime position to get that visual indicator should the test be successful.
We’ve known for a long time now that page speed plays a part in the ranking algorithms, with initial announcements focused on mobile search. This announcement is building on that but applies to Desktop and different search features as well as Mobile search.
So how do you really get ahead?
- Explore GSC and the new Web Vitals reports, understand your data and the classification of URLs across your site.
- Identify areas within the report that need improvement, then prioritise based on effort/scale/impact.
- If you can see a small impact by changing a couple of things across a large number of URLs, you’re going to see more of an overall lift than you would if you spent a lot of effort fixing a handful of URLs
- Prioritise, then optimise.
- Cross-reference the “Poor” URLs being flagged for each metric with other GSC and GA data, e.g.
- Mobile usability
- Impressions (by device)
- Sessions (by device)
- Page engagement metrics (by device)
- Cross-reference the “Poor” URLs with other tool data, e.g.
- Google Ads (formerly AdWords) landing page experience reports – a factor of the landing page experience is mobile speed, if its flagged there, its probably also flagged in the Web Vitals report
- PageSpeed Insights – to get supplemental metric data
- CrUX – to get supplemental metric data
- Test, measure, deploy, measure.
- Test implementation on a sample of pages
- Measure impact on page sample (speed, impressions, sessions, engagement, conversions etc.)
- Deploy implementation at scale for affected URLs (most often a template change will impact the whole site)
- Measure impact across the site/all affected URLs
It might not be an immediate switch, but we all know development and implementation takes time. So, the sooner you start looking into the data, potential issues, potential causes, and required time to fix, the sooner you’ll be able to start prioritising the “problem” areas and getting them into a good state ahead of the upcoming rollout. And because we’re all marketers, and we all love competition, the sooner your site is sorted, the harder it will be for competitors to overtake you.
Core Web Vitals FAQs
Mid-June 2021, along with other page experience signals like safe browsing, HTTPS, mobile friendly, and no intrusive interstitials.
End of August 2021.
A series of new measurements that Google will use to determine page experience. There are currently three metrics: Largest Contentful Paint (LCP), First Input Delay (FID), and Cumluative Layout Shift (CLS).
Google scores the webpage as Poor, Needs Improvement, or Good. Each metric has its own threshold, but to fall into the “Good” bracket, your webpage needs to be in the 75th percentile across desktop and mobile.
Yes, a “Poor” score will count as a failing mark for your webpage.
Yes, the Core Web Vitals will become part of the overall Search algorithm from Mid-June 2021, alongside other Page Experience signals already included, but the rollout won’t be complete until the end of August 2021 so you may see changes at different points.
You can check your scores for individual pages in Google Search Console as you would other performance inspections. There is also a tab in Google Search Console specifically for Core Web Vitals where you can see your overall scores and any issues with performance.
For quicker, on-the-go inspection, you can use the PageSpeed Insights tool.
Yes, but you’ll need to use a couple of APIs to do so. The PageSpeed Insights API and the Chrome UX Report API both pull lab and field performance data and include the Core Web Vitals metrics, so as long as you’re comfortable using APIs, measuring in bulk should be a breeze.
Yes. There are a number of supplemental metrics already in play, including Time To First Byte, First Contentful Paint, Total Blocking Time, and Time To Interactive. The Core Web Vitals build on these supplemental metrics as well as field insights to provide greater insight into the page performance.
Yes. Google Search Console will let you track how performance for each metric changes just as it does all other insights. With the APIs, you can also set up custom dashboards to monitor changes over time and update as implementations are made.
Need some support?
If you need some help understanding your current performance and what actions you need to take to improve it, our SEO team are experts at delivering Core Web Vitals audits with actionable recommendations. We can help guide you through the process and wherever possible will assist with implementation.
Arrange a Core Web Vitals audit.