Workshops are beautiful: Roundup
Notice: Undefined variable: post_id in /home/foundco/public_html/wp-content/themes/pivot-child/inc/content-post-single-sidebar.php on line 48

Creating data visualisations can sometimes be tricky, it’s easy to fall into the trap of thinking that you have a good idea and all the elements you need to make it, only to be a bit underwhelmed by the end result. To find that something doesn’t quite sit right in the final version and that you have to start over or re-work the idea can be frustrating.
To hone our skills and get a wider understanding of how some of our favourite data visualisations were made, we decided to head along to David McCandless’ ‘Workshops are Beautiful’ event at the Soho Hotel in London. David’s book ‘Information is Beautiful‘ is a big favourite on the bookshelf here at Found, and with David being one of the leading figures in the field, who better is there for us to pick up some tips from?
What did we learn?
One of the key early takeaways for me was the emphasis David stressed on how important the data analysis and research part of every visualisation is; with 80% of his time and resource going into that for each graphic. It might sound quite obvious but when you’re actually making one it’s easy to over prioritise the design and creation elements.
Another very important element is brilliantly outlined with the below Venn diagram:
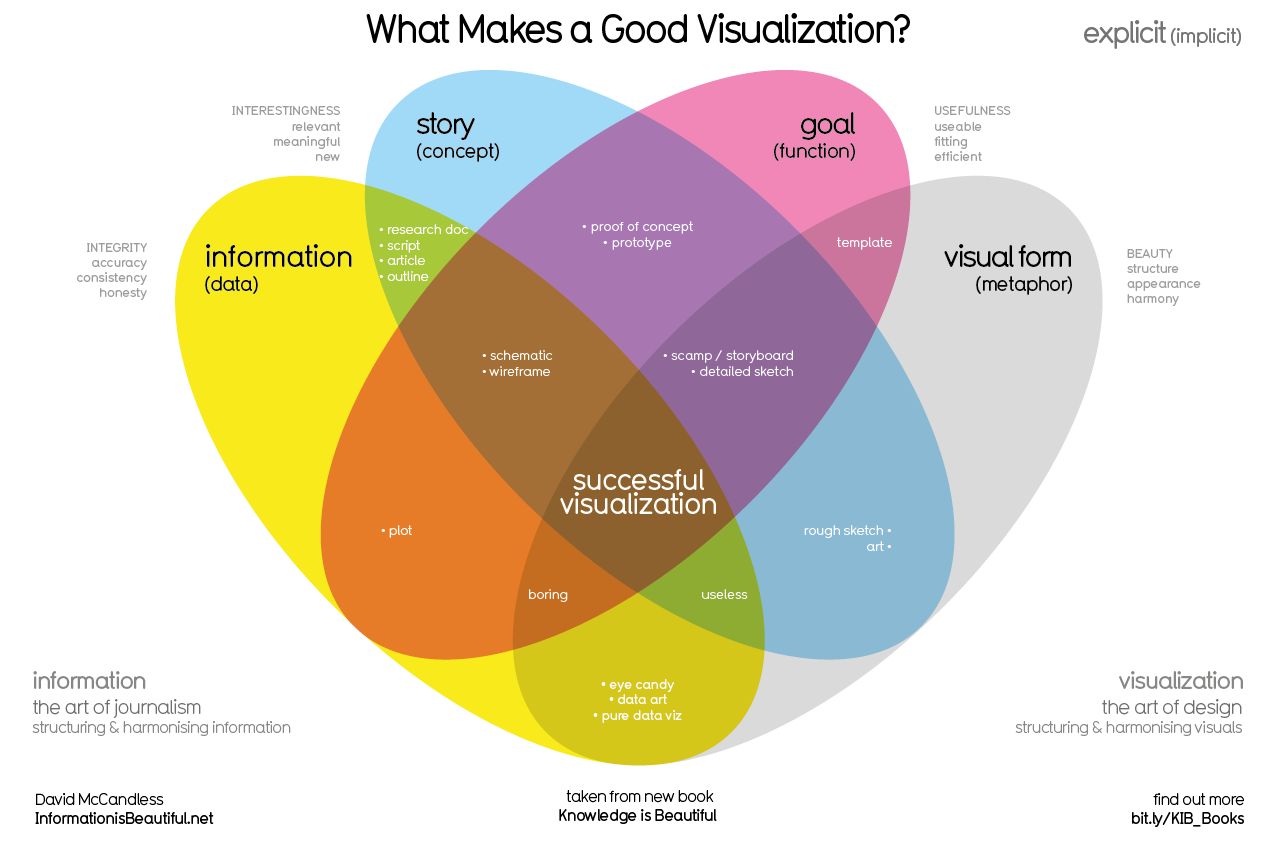
The four pillars of a visualisation: 1) data, information 2) story, concept 3) goal, function 4) design, visualisation must all come together if your data visualisation is to be successful. Leave one out and it will unlikely fulfil its potential, with the piece feeling and looking incomplete, substanceless, poorly executed or just plain boring.
Finding the story within the data can be half the battle, but then presenting that in its most engaging light is equally important. One example that was used in the event was ‘What country spends the most on its military?’ an interesting topic in itself, but by applying a metric to change the expected outcome ‘What country spends the most on their military in relation to population size?’ it suddenly becomes much more engaging. The results are unexpected, even shocking! This lesson is a valuable one and one of the key reasons why David’s data visualisations are so powerful.
He also got us thinking in photographic terms about how best to present the data. How zoomed in to the detail do we want to be? Is it a wide angle shot or a close up? Picking and choosing what to present from the data set to make for the best possible story is a key decision, with the whole data set often burying the most interesting bits within it.
Choosing the right type of visualisation to best present the data was another focus and it was interesting to see just how many data visualisation types there were on the list, from bubble tables and polar charts to atmospheric timelines and wordclouds. The key takeaway here is that there is likely to be an existing format perfect for your data story rather than you having to invent a new type of graph or chart.
Once this is defined, the visual vocabulary comes in to play allowing you to start really formulating what the data visualisation is going to look like. Are you using colour or symbols to distinguish between the elements in your data? What does the font say? Are textures or line weights important? Does the size, arrangement or proximity of elements correspond to the data you are illustrating ? Lots to think about here but there is something to be said for keeping it simple and only including vocabulary if it is playing a strong part in illustrating your data story.
All in all it was a fascinating day, and it being a workshop there were interactive elements too. We all got to share our ideas for data visualisations with the group, and lots of us got some feedback and suggestions from David and the group as to how to potentially improve or solve problems with our ideas. A really worthwhile day that left us with lots to think about.
In summary here a some key points we took away with us :
– Don’t underinvest in the research and data analysis
– Make sure you include all the four pillars of data visualisation – data, story, goal and design
– Think about including a metric which enhances the story and makes the data more engaging
– Think about how you will frame the data, exclude data that doesn’t support the goal or story
– Find an existing format that suits your data set
– Define your visual vocabulary carefully to help you tell the story
Follow these top tips and you’re well on the way to creating a great data visualisation!
Download our latest whitepaper
SEARCH RETARGETING:
THE POWER OF CAPTURING INTENT BEYOND SEARCH.