Predicting Black Friday:
AUTHOR
Head of Data Science
SHARE
Please consider sharing:
OVERVIEW
INTRODUCTION.
The findings in this report will give you the insight required to prepare for changes in user and shopping behaviour in advance of the biggest shopping period of the year, giving your marketing department a leg up in forecasting, budget management, and campaign planning across different scenarios.
THE DATA PART.
LEARNING FROM THE PAST.
To really know how we expect Black Friday to play out this year, and whether we expect to see any significant differences from last year, we first need to know how last year performed across different industries. So, we set out to understand how users behaved in 2019, hour by hour, across a range of sectors.
SUMMARY.
As ecommerce has seen a massive change, at Found we conducted an analysis of last year’s Black Friday and forecasted this year’s to gain insight into one of the biggest digital shopping days of the year. For this, we conducted analysis within 4 key areas:
1. Analysed Black Friday data from our clients in 2019, to uncover an hourly play-by-play, showing 4 distinct patterns of user behaviour:
GROUP 1: POST WORK PEAK. Highest traffic between 7pm – 9pm Retail websites.
GROUP 2: MIDDAY PEAK. Highest traffic between 11am – 3pm Non-typical Black Friday websites like Recruitment & Enterprise tech.
GROUP 3: PRE-WORK CLIMB. Highest traffic between 6am – 9am Retail, Software / Tech websites.
GROUP 4: PRE-WORK CLIMB WITH AFTERNOON REDUX. Highest traffic between 6AM – 9AM with second peak between 3pm – 5pm B2B sites.
2. Compared retail event day activity segmented by device to show that UK Black Friday shoppers on mobile are the biggest contributor to online retail sales for our clients.
3. Using ONS data, we forecasted online sales (as a proportion of all sales) on Black Friday to be up from last year by 9% (minimum predicted) all the way up to 65% (maximum predicted).
4. Identified three distinct peaks in influencer marketing interest, with the biggest being in summer, and the second biggest at the end of November, which we theorise is businesses preparing for Black Friday and beyond influencer marketing campaigns / gifting.
BLACK FRIDAY 2019 PLAY-BY-PLAY.
By performing a clustering analysis, we found four distinct patterns of user behaviour on Black Friday 2019 (plus one outlier):
An important note:
The findings presented here are more anecdotal than scientifically robust. They are trends we’ve noticed across our own clients in different industries. The data we used was hourly user counts on Black Friday 2019 for each account – for organic and direct UK traffic only, to ensure changes in traffic reflect the natural day rather than being influenced by media spend. These four core trends can be summarised as below. In each group below, we’ve illustrated the change in user traffic, with the chart in pink showing the most typical behaviour of the group.
GROUP 1: POST WORK PEAK.
The companies in this group saw user counts ramping up from around 9 AM, remaining relatively level until the evening (around 7-9pm) where total users reached their peak. The companies we saw with this pattern of behaviour were usually medium-to-high traffic retail ecommerce sites, including clothing, food & drink, as well as gift buying sites.
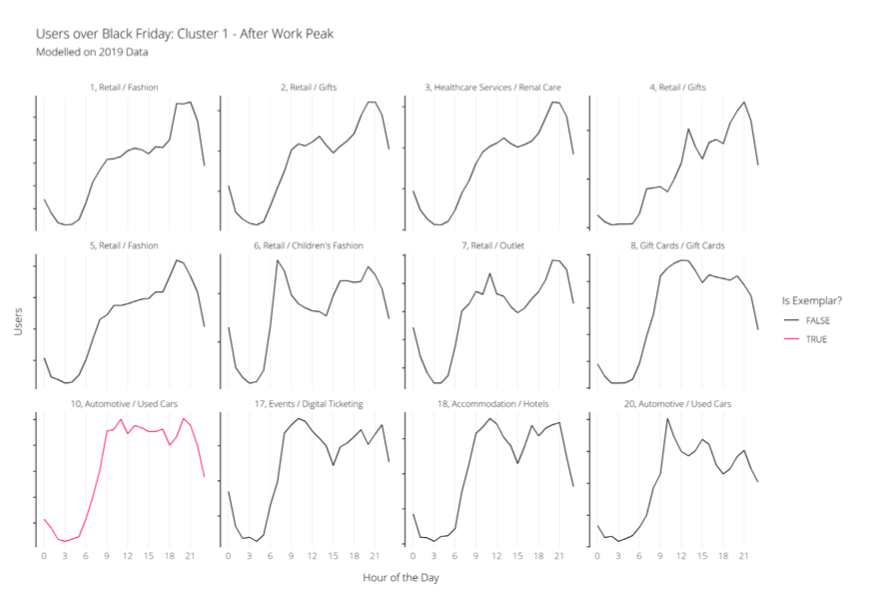
The ramp up in the evening suggests last-minute deal hunters – people who have been keeping an eye on things throughout the day and are ready to purchase in the evenings, after they’ve finished work and are settling into downtime. Typical across ecommerce, it is likely that this year will see a similar trend to 2019 for this group.
Gifting is also likely to play a big part in the performance of this group, with a study from PwC from Black Friday last year stating that women are more likely to buy for others (71%) than they are themselves (67%).
GROUP 2: MIDDAY PEAK.
The companies we saw with this user behaviour are not companies typically associated with Black Friday hype, for example recruitment or enterprise technology, which meant we saw little difference from a ‘normal’ day.
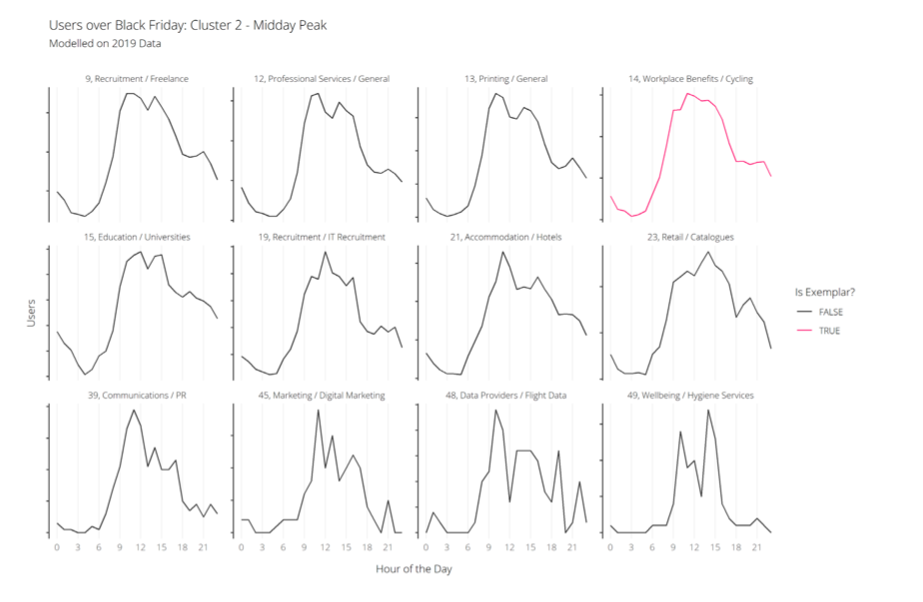
We still think there is something to be learnt here, as changes in the way people shop in other industries can have an indirect impact on these companies. An example of this could be the drop in evening traffic, due to people shopping online in the evening. So, if you’re operating in a non-typical Black Friday industry, e.g. B2B, you might see traffic drop off in the evenings and need to focus more attention on driving traffic to your site earlier in the day.
GROUP 3: PRE-WORK CLIMB.
In our third group, we saw companies with their highest amount of traffic at the start of the day, before typical work hours get under way. From that point onward, users steadily drop off with some having a mini peak post-lunch. The categories of these companies include a mix of ecommerce sites e.g. consumer electronics, and software / technology.
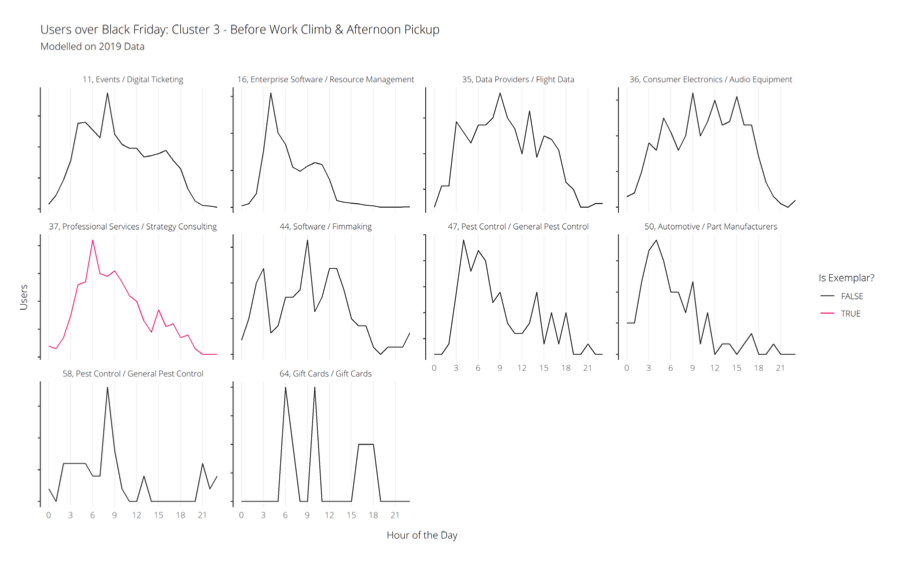
If you’re seeing this behaviour from your Black Friday 2019 data, then your users could be tech lovers / early adopters. Similar to Group 1, it is likely that this behaviour will be reflected this year as well, so if your users are much more tech-heavy you might see increases in traffic in the earlier hours of the morning if you sell products to serve those needs. Otherwise, you are likely to see lower levels of traffic during the morning while your users complete their research and purchases elsewhere before returning as normal for the afternoon.
GROUP 4: PRE-WORK CLIMB WITH AFTERNOON REDUX.
Very similar to Group 3, except here we see a pronounced second peak in the afternoon around 3-5pm. Generally, this group includes B2B companies with lower traffic than ecommerce. This aligns with the afternoon redux we see.
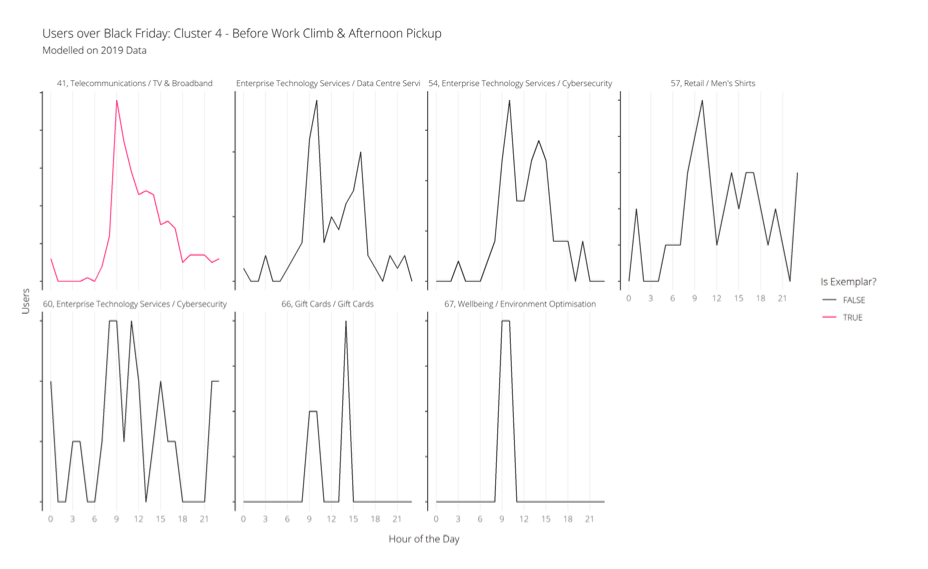
The afternoon spike suggests that users are browsing at work, for work – looking for deals or offers related to their own industry, or taking the opportunity to focus in on future planning while their own industry sees lower than normal traffic as a result of Black Friday.
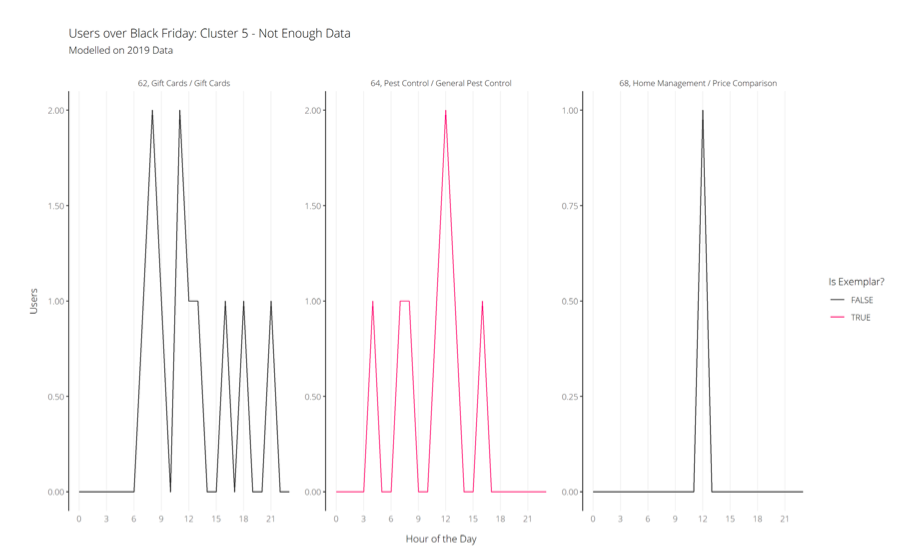
GROUP 5: THE OUTLIERS (CATCH-ALL).
We did see other patterns in our data, but there wasn’t enough information to inform any reliable conclusions. In our outliers, we saw some companies with spikes around noon, with other much more random spikes during the day. These spikes are likely influenced by other activity throughout the day and so are unreliable data points to use as a model for how this year might behave.
HOW DO THESE PATTERNS COMPARE TO A ‘NORMAL’ DAY?
To provide some more context to the grouped patterns seen above, we looked at a ‘normal’ day to see if users actually behave differently on Black Friday.
We approached this in two ways; the first by looking at the relative difference in user traffic patterns. The black lines show Black Friday and the green lines show an ‘average’ day.
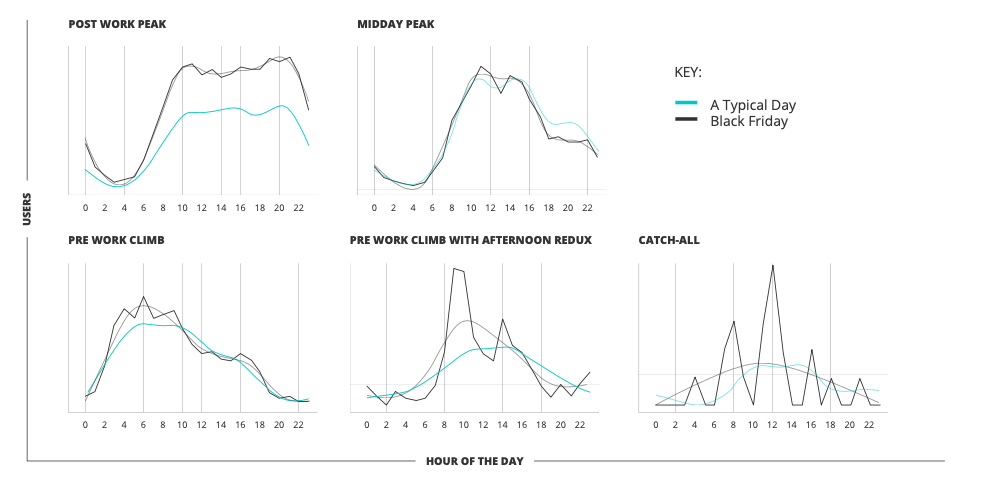
Interestingly, the patterns are generally still indicative of each group, but with increased volumes. Good news, as these insights can be applied across the year, not only on Black Friday. In the chart for Group 4 (pre-work climb with afternoon redux), we can see that Black Friday has a dampening effect on B2B companies in the evening, confirming our suspicions from earlier.
The second part was to look at the percentage difference for more context. The charts below show the average percentage difference between user traffic on Black Friday and a typical day.
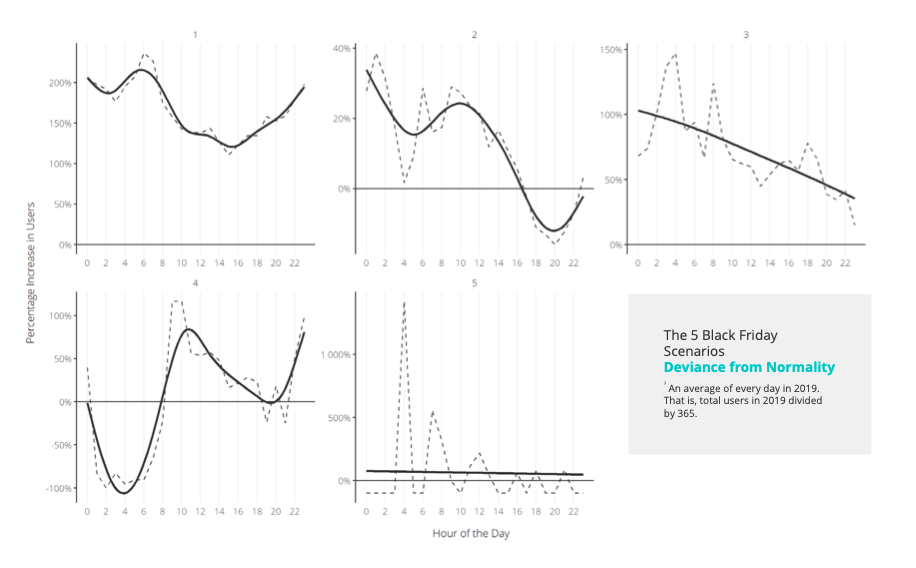
Here, we can see that for groups 1, 2 and 4, the biggest changes in user traffic behaviour happen at the start and end of the day. Again, this confirms earlier analysis into peak traffic times for each group, and suggests that we’re likely to see a similar pattern emerge in 2021.
MODELLING BEHAVIOUR.
LEARNING FROM THE PAST.
Now that we’ve got insight from last year’s Black Friday data and how performance shaped up throughout the day,how can we use it to look at this year’s likely outcomes? With a model.
WHAT IS A MODEL?
Models: used in our society across science, maths and fashion. But what is a model? At its core, a model is an example to imitate, whether this example is a person wearing clothes or a system of variables and numbers. Modelling is key to understanding complex systems with many moving parts, organising the information to make sense of what the data is telling us in a story we can understand. It’s been said time and time again4, that people who think with models, tend to outperform and make better decisions than those who don’t. Applications for models are vast, from financial services using them to assess risk, to governments using them to predict the spread of COVID-19. At Found, we work on taking our data and making models that can help our clients perform better and help us think more strategically and predictively.
RETAIL DAYS – WHICH ONE WINS OUT?
Looking at data from our retail clients, we compiled the percentage of all online revenue segmented by retail event days:
- Blue Monday
- Singles’ Day
- Black Friday
- Cyber Monday
- Christmas (21st December and Boxing Day)
In our comparison, we’ve also added in a regular day for reference.
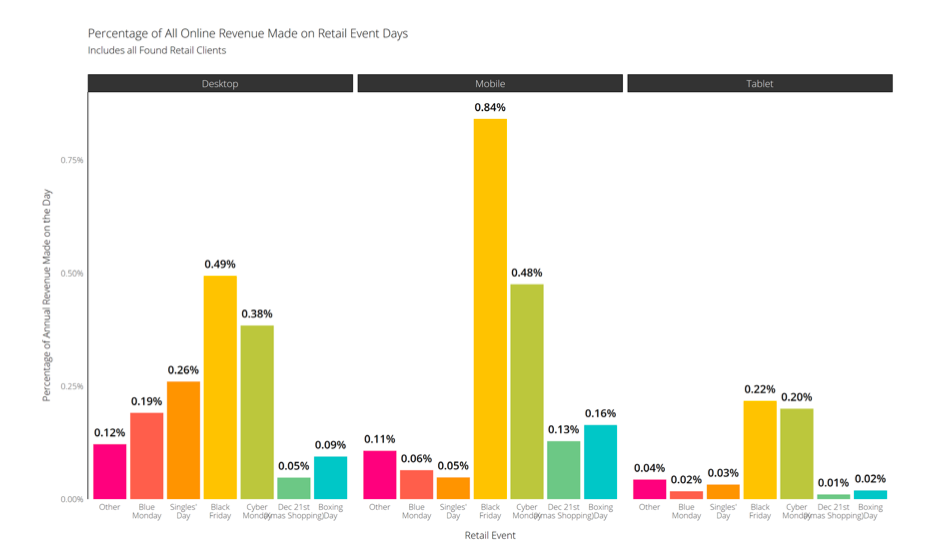
Black Friday is the overall winner, with the biggest percentage of online sales made on that day across desktop, mobile and tablet devices. Cyber Monday comes a close second, but for the other retail event days we see clear differences across devices.
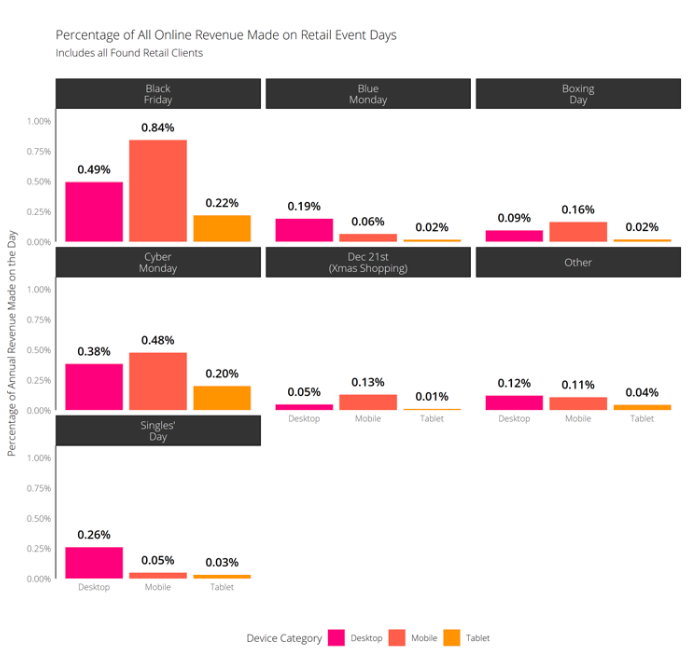
Note: ‘Other’ here refers to an average day, i.e. the average of all days that are not one of the named retail events (Black Friday, Cyber Monday etc.)
On desktop, Singles’ Day wins out over Christmas and Blue Monday shopping. On mobile, Black Friday had almost double the percentage of sales than Cyber Monday, with Boxing Day being the third biggest day. For our clients, mobile is the biggest contributor to online retail sales on Black Friday and Cyber Monday.
In terms of the days themselves and how they performed, Black Friday was the clear winner but, more interestingly, was the lack of revenue recorded on December 21st for last-minute Christmas Shopping, with the lowest contribution recorded, meaning the best performing days in order were:
- Black Friday
- Cyber Monday
- Singles’ Day
- Blue Monday
- Boxing Day
- Other (average day that isn’t a named retail event)
- December 21st
For most shoppers now, Black Friday and Cyber Monday are huge retail events, and in recent years there has been speculation that people are using these days to buy their Christmas presents which may explain why December 21st (potentially as the frequent final order day for guaranteed delivery) shows such low contributions. In a Pricesearcher survey in 2019, 30% of respondents said they intend to make Christmas purchases during Black Friday. Interestingly, 57% of women said they intended to make purchases on Black Friday exclusively for Christmas.
This opens up opportunity, not only for Black Friday messaging in your campaigns (e.g. ‘don’t miss out’) but also Christmas messaging (e.g. ‘get ahead’) around the same time, as well as drilling into your own estimated gender breakdowns and audience targeting to split campaigns and test different messaging on different groups.
From the models used, we can assume that similar behaviour will take place this year. When it comes to winter retail planning it is worth keeping these dates in mind for media plans, and overall campaign plans, for which should get the most of your attention.
We’d also recommend paying particular attention to device splits, and assessing how device usage changes in the run up to key retail events. For example, in 2019 71% of UK shoppers did their Black Friday shopping from a mobile device, and while that may be less likely this year with a lot more people working remotely, it would be naïve to assume that mobile devices won’t play a huge part of the purchase journey again this year. In fact, a recent survey from Statista states that 45% of respondents had increased their smartphone usage since the pandemic, compared to 42% on desktop.
Note: It’s important to remember that this is only what we’re seeing with our clients, for example Alibaba saw that their Singles’ Day was the biggest day of their year, eclipsing Black Friday and Cyber Monday. So, whilst we’ve made every effort to account for different scenarios, you should always consult your own data to tie into your media plans.
INFLUENCERS AND BLACK FRIDAY.
We were also curious to see if there was a relationship between the demand for influencers and Black Friday – for most ecommerce sites, the biggest online retail day of the year. Looking at the trends from our own influencer and youth marketing agency, Disrupt, we analysed the traffic coming in and saw three distinct surges:
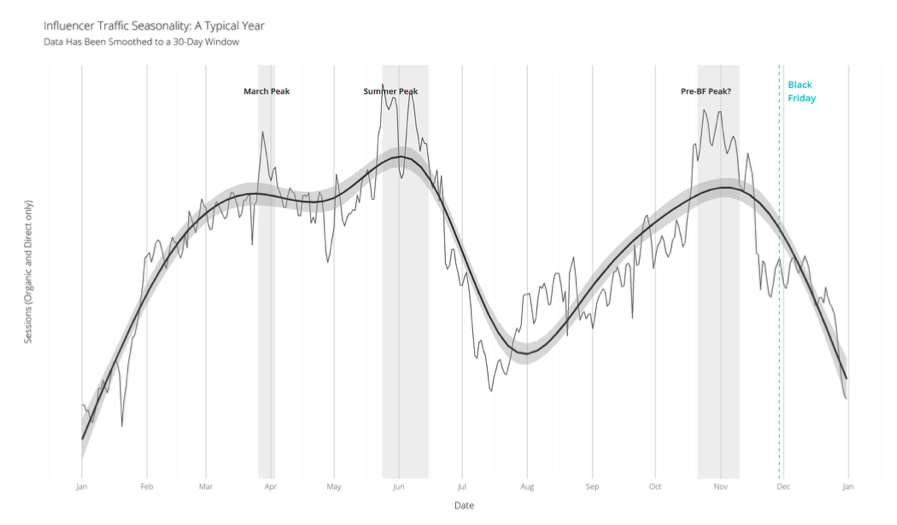
END OF MARCH.
The first peak of the year, only lasting a couple of days. We’ve theorised that this is due to the start of the financial year, and businesses are exploring how they can benefit from influencer marketing, whilst budgets are fresh of course.
SUMMER.
The second peak of the year at the end of May / beginning of June is also the biggest. Here we see early birds planning for the end of Summer, through the Autumn where the big sales happen.
BLACK FRIDAY.
The final peak of the year happened slap bang in the middle of spooky season, the end of October / beginning of November. Slightly smaller than the Summer peak, but just as distinct. The surge in traffic starts to level off into November, which suggests it could be related to either last minute Black Friday campaigns, or more generic Holiday / Christmas influencer planning.
These peaks suggest influencer marketing tends to be planned a few months in advance of key events, with many opting to secure influencers in early summer. The peak towards November suggests companies are looking to secure influencers for the key retail periods, if they haven’t already earlier in the year, to help amplify their campaigns throughout November and December.
This then lends itself to a much more diverse marketing plan – utilising multiple channels, platforms, and methods to generate maximum exposure, capture that traffic, and then convert it – all within weeks and likely at much shorter than average purchase lengths.
THE ONLINE JUMP.
Looking at data from the ONS, we wanted to see if we could effectively model the changes seen in retail throughout 2021 and map it to Black Friday. From the data, we saw that internet sales spiked as soon as lockdown started in the UK on the 23rd March – big surprise! In past years, sales have been steadily growing more digital but 2021 saw an unprecedented explosion of online sales.
The charts below show the proportion of sales made online (as a percentage of all sales, both online and offline). The lockdown ‘jump’ is immediately obvious and echoed across industries. These spikes have already dropped though, taking a couple of months to drop to ‘normality’ by July.
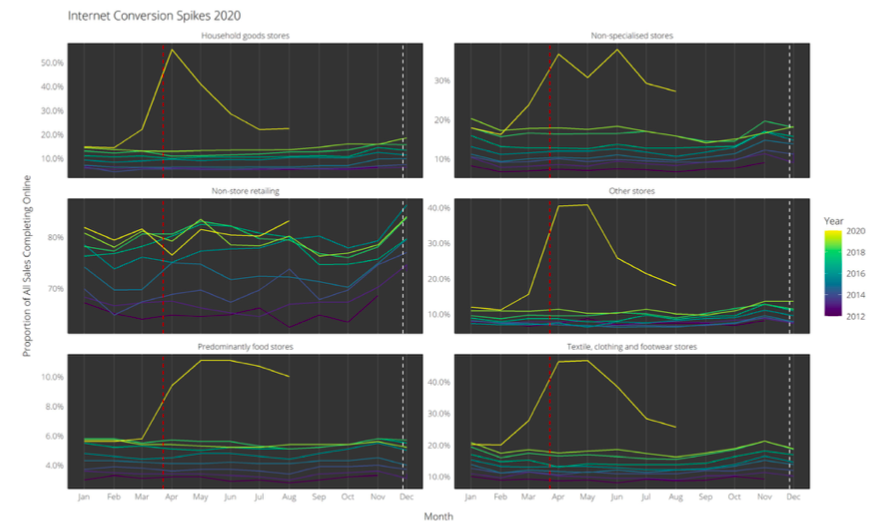
A note on ‘Non-store Retailing’: The ONS uses this category to refer to home shopping, including pure play ecommerce sites like ASOS as well as mail order, catalogue sales, online shopping, internet trading platforms, travel portals, and teleshopping.
THE NEW NORMAL BLACK FRIDAY?
As the March spike in internet sales has dropped, the levelling off is still markedly above the previous years. Does this mean Black Friday will be bigger than ever this year? Possibly not. A recent article from Google stated that 61% of UK shoppers say the pandemic will affect their holiday shopping this year, meaning that some may opt to spend more online than they have in previous years, where others may be being more cautious.
So, we did some more digging and some more modelling, and have produced an educated estimate of what the online sales landscape might look like come Black Friday.
BUT HOW CAN YOU PREDICT THE FUTURE?
It is very difficult (read: virtually impossible) to forecast forward from an unexpected spike based on the little data available, without some complex feature engineering work. But, we can run a regression analysis to extrapolate this year’s current trend and imagine what it might look like come Black Friday, should the lines just naturally progress. The grey area shows where it is likely the data points will fall based on current data – at a 95% confidence interval.
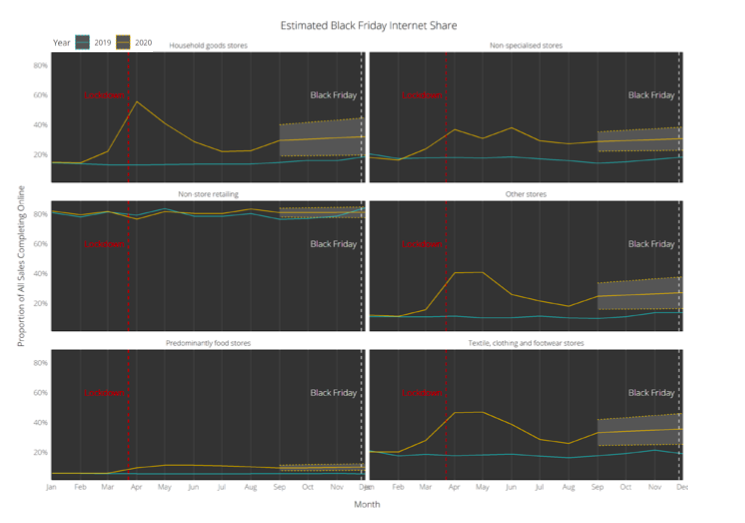
Looking at a best case scenario, sales on Black Friday could almost match up to lockdown spike levels, especially in ONS categories like Household Goods, Textile, Clothing and Footwear stores. However, the future is fickle, and sales could land anywhere in the aptly named grey area on the charts above. If looking at the worst case scenario, then it’s possible sales could decline below the new raised 2021 normal, though this is still above levels of 2019 and earlier.
The table below summarises what we are expecting this year. Generally, expect online sales to take up a higher proportion of your overall sales. Most of our predicted minimum online sales percentages are still above Black Friday 2019 levels.
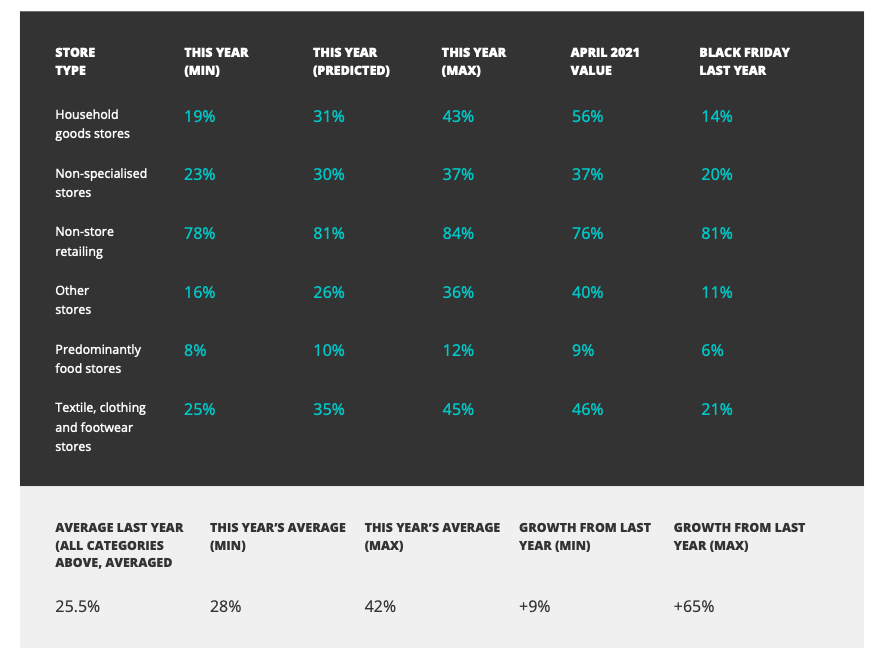
With anticipated performance exceeding 2019 levels, even at the lowest prediction, we can assume trends throughout 2021 for the rise in online sales will continue across different industries through key retail periods.
Should Black Friday 2021 reach the highest anticipated prediction, the volume of online revenue driven will be monumentally increased vs. 2019. So, how can you use all of this information to start preparing your campaigns?
I’LL TAKE MY INSIGHTS TO GO, PLEASE.
It’s safe to say that you should expect the unexpected. The proportion of online sales generally in 2021 is much higher than expected, with the ‘normal’ baseline higher than levels in 2019 and earlier. Black Friday has the potential to mimic the massive spikes we saw post lockdown but also the potential to stay at baseline (or dip).
Online retail is fast on its feet, so it’s worth having a few tricks in the bag if performance wobbles on the day, including:
- Ad copy covering off predicted low and high scenarios
- An extra discount code for when people need a little poke Leeway in your ad budgets for ebbs and flows
- A ‘peak period’ specific basket abandonment setup
- Device-specific targeting for awareness and conversion
THE ACTIONABLE PART.
PREPARING FOR PEAKS.
With everything we know about ‘usual’ performance being turned on its head this year, 2021 is going to be a little different to prepare for. There are some fundamental aspects you’ll need to consider as normal, but also some new elements to work into your plans.
Realistically, companies are likely to fall into one of the four core groups outlined earlier:
- Post-work peak – highest traffic between 7pm – 9pm.
- Midday peak – highest traffic between 11am – 3pm.
- Pre-work climb – highest traffic between 6am – 9am.
- Pre-work climb + afternoon redux – highest traffic between 6am – 9pm + second peak between 3pm – 5pm.
From our models, we can assume that these groups will remain relatively consistent in 2021, so if you saw spikes around specific times of day in 2019 you can expect to see them replicated this year, with most in the retail industry specifically likely to fall into Group 1.
However, there are elements you’ll need to plan for outside of previous years’ behaviour, so we suggest looking to your own data to assess the following:
1. Highest performing traffic periods vs. highest performing conversion periods.
2. Highest trafficked sections of your website as well as highest trafficked product pages.
3. Highest converting product pages historically. Highest performing channels, and how this has changed since last year.
4. Highest performing campaigns, and how these have changed vs. pre-lockdown levels.
Once you have that information, you’ll know more about which group you fall into. Then, you can follow these steps to help you prepare:
GROUP 1: POST WORK PEAK.
Most commonly, pure-play ecommerce websites, allowing for a plethora of platforms and features to be utilised to amplify existing activity and take advantage of increased traffic levels.
1. Pace budget throughout the day to allow for increased spend during peak time (7pm – 9pm).
2. Run awareness campaigns in the lead up then switch to conversion / action campaigns throughout the day.
3. Hard push on conversion campaigns towards the end of the day.
4. Adjust messaging to account for increased purchase potential later in the day.
5. Providing stock is available, there is potential to push for ‘new offers’ or ‘exclusive deals’ messaging later in the day, taking advantage of increased traffic periods to push the best deals.
6. Schedule email campaigns around peak periods – potential for a midday teaser followed by an early evening ‘don’t miss out on X’.
7. Take advantage of shoppable platforms and ad formats, including across social media, YouTube, Search, and Google Shopping to maximise exposure and capture demand as it is raised.
GROUP 2: MIDDAY PEAK.
Most commonly, non-typical Black Friday websites, such as enterprise or recruitment, meaning you’ll need to be planning around peak shopping periods to make the most of the traffic coming to your site:
1. Plan for usual campaign spends and pacing throughout the day, but allow for an increase in spend between peak periods (11am – 3pm).
2. Continue with usual activity, but look to work in Black Friday messaging – this is a chance for your social teams to get creative, tying the event back to your own platforms.
3. Plan for post-peak data pieces – this is another chance for your content teams to get creative and assess trends in your own website’s performance and tie that back to behaviour for Black Friday to create new data journalism content and put a company spin on it.
4. Allow for a drop off in traffic later in the day, when Group 1 sees an increase.
5. If your conversions tend to come through in the evenings, plan for a quieter period over the Black Friday and Cyber Monday periods.
6. Work with your sales and marketing teams to reassess the user journeys to make it as simple as possible for users to convert through this period.
7. Look into launching CRO experiments on key conversion touchpoints – if users have less time to convert than normal, they should react positively to shorter journeys.
GROUP 3: PRE-WORK CLIMB.
Most commonly, lower trafficked ecommerce and software/technology companies need to be planning for increased activity in the morning and then a drop off throughout the day:
• Pace budget throughout the day to allow for increased spend during peak time (6am – 9am).
• Plan for a drop off in traffic post 9am, with potential to shift campaigns to more of an awareness focus while conversion potential is lower.
• Allow for an increase in spend in the afternoon as behaviour is likely to return to normal levels.
• Set up awareness campaigns in the run up to Black Friday – users are likely to be searching in advance and while not purchasing, or converting, this is a good opportunity to increase customer awareness of your brand, particularly if your audience are tech lovers / early adopters.
• This is a good opportunity to trial YouTube ads, with 79% of users last year reporting they used both YouTube and Search as they researched purchases – a great time to get your brand out there.
GROUP 4: PRE-WORK CLIMB + AFTERNOON REDUX.
Most commonly B2B websites, the core focus will be maximising the potential of the traffic coming through to your site on the day:
1. Work with your sales and marketing teams to reassess the user journeys to make it as simple as possible for users to convert through this period.
2. Trial CRO in the run up to Black Friday (throughout October and early November) on key conversion points on your website – the easier you can make it for users to convert, the better.
3. Allow for increased spend in the early hours of the morning (6am – 9am) and mid-afternoon (3pm – 5pm) to account for the two spikes seen from the models.
4. Look into trialling YouTube for awareness and increased exposure in the run up to Black Friday.
5. Allow for a slight drop in conversions on the day while users go elsewhere for deals and shopping, before returning to normal levels relatively quickly afterwards.
GENERAL PREPARATION.
Most commonly, pure-play ecommerce websites, allowing for a plethora of platforms and features to be utilised to amplify existing activity and take advantage of increased traffic levels.
1. Pace budget throughout the day to allow for increased spend during peak time (7pm – 9pm).
2. Run awareness campaigns in the lead up then switch to conversion / action campaigns throughout the day.
3. Hard push on conversion campaigns towards the end of the day.
4. Adjust messaging to account for increased purchase potential later in the day.
5. Providing stock is available, there is potential to push for ‘new offers’ or ‘exclusive deals’ messaging later in the day, taking advantage of increased traffic periods to push the best deals.
6. Schedule email campaigns around peak periods – potential for a midday teaser followed by an early evening ‘don’t miss out on X’.
7. Take advantage of shoppable platforms and ad formats, including across social media, YouTube, Search, and Google Shopping to maximise exposure and capture demand as it is raised.
FOUND(ER) TOP TIPS.
If you’re an e-commerce site, don’t always focus on creating new pages for Black Friday. Optimising existing pages can often mean higher rankings over the Black Friday period, and result in less confusion when Google’s trying to understand what products to show users over the Black Friday period.
– TOM BRAND, HEAD OF SEO OPERATIONS
With content on Black Friday, email is a great channel to speak to potential customers. Before Black Friday, sending out a heads up on discounts can go a long way – you’re helping prospects plan purchases which will give you a lot of brownie points. For people who have an account with your site, and visit on Black Friday, you can target them with an email with another offer to entice them after the fact. If all else fails, you could email them and ask them why they didn’t go all the way on the day. Could be valuable insight for next year.
– LEENA KESISHIAN, CREATIVE STRATEGIST.
Review previous years’ paid search and Google Search Console performance data to identify the most successful keywords and new targeting opportunities. Use these to inform the creation of new landing pages, on-page keyword targeting and ad and meta description messaging.
– PHILIP GAMBLE, HEAD OF SEO STRATEGY.
Make sure to confirm messaging and get ads built out and scheduled in accounts ahead of time. With so many advertisers changing messaging over at the same time, approval times (especially on Facebook last year) can take longer than normal.
– NATALIE PATEL, DIRECTOR OF GROWTH EXPERIENCE.
Set up in-day pacing reports by campaign to highlight when individual campaigns are running out of budget so you can assess whether or not you want to keep spending to meet the demand.
– BECKY JAMES, PAID MEDIA ACCOUNT DIRECTOR.
Do not underestimate the power structured data can have during this period – the more information you can give users in the SERPs, the better the chances are of them clicking through and converting on your site over a competitor. Make sure it is set up on product pages specifically and is validating correctly with all the right information.
– IMOGEN DAVIES, SEO ACCOUNT DIRECTOR.
James Wolman, Head of Data Science - 05 Dec 2019
Please consider sharing:
Tags
Black Friday, Data, Digital Marketing, Paid Media, PPC, SEO, B2BRetail
Date
05 Dec 2019