10 questions your keyword research should be able to answer
Notice: Undefined variable: post_id in /home/foundco/public_html/wp-content/themes/pivot-child/inc/content-post-single-sidebar.php on line 48

It’s Friday – late afternoon. You’ve finished your keyword research document for your shiny new client. You click save for the last time and close the barely responsive spreadsheet. Relief washes over your weary soul. The weekend’s siren song is almost audible. It sounds like Chris de Burgh. There’s just enough time left in the working day to check the Found blog – what better time to catch up on the latest insights in the field? And here you are. Of all the posts on all the web, you chose to click onto this one. Believe us when we say your client will be dazzled by all the new insights you’ll be weaving into your improved keyword research document after learning these ten handy tips, so sit back and and enjoy ‘til closing time.

Cheers!
1. Which products and services does the client actually offer?
Most SEO keyword researchers rely on AdWords Keyword Planner for their data. This is understandable as it is the most reliable source around – most of the other keyword search volume tools get their data primarily from here. When you placed your client’s primary keyword into Keyword Planner, it came back with a series of suggested Ad Groups – sub groupings of keywords which it thinks are related to your primary keyword. But are they all related to your client’s business?
Portfolio groups
These are based on Ad Groups but they’re better. They give structure to your keyword research and allow it to be digested at the topic level rather than at the keyword level – useful for a broader view. First, read your data and get rid of those Ad groups which are just plain silly. Sometimes Keyword Planner gets it wrong and it’s often easy to miss rogue groups which look related to your client’s business but are in fact about something else entirely. For example, the group “boots uk” is actually about Boots the Chemist and not wearable boots – but you’d have to actually read the keywords in the goup in order to determine that. Which brings us on to the naming of the Ad Groups. The Ad Groups are rarely named well. Sometimes it gets it right but most often, a group containing keywords about theatre tickets in Manchester will be called something like “Tickets Manchester”. So dive into the CSV, say goodbye to bogus Ad Groups and give them nice new names as Portfolio Groups. Your client will thank you. Depending on the number of groups, rainbow colours are an option here to help us identify the portfolio groups more easily and enjoyably. 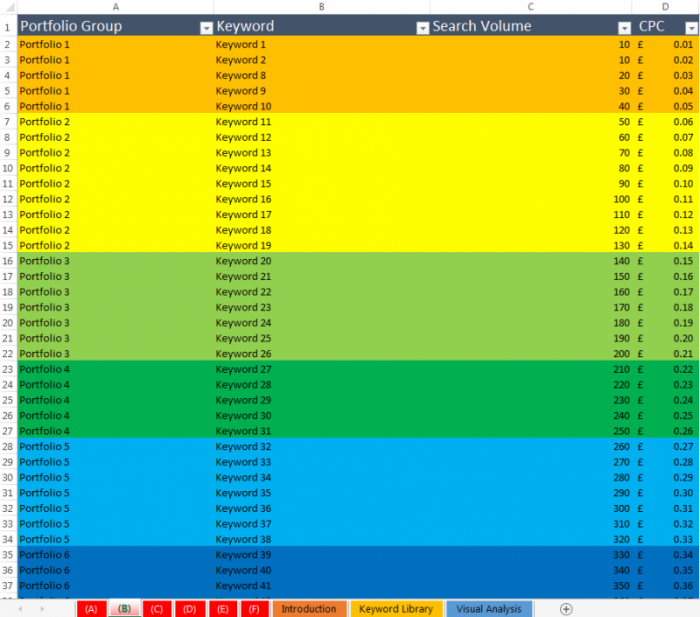
2. How many people are interested in these products / services throughout the year?
Ok it’s pretty unlikely that you have missed search volume, seeing as it’s the most basic component of Keyword Analysis. But how about seasonality?
Search volume and seasonality
Google’s “Average Monthly Searches” data is averaged over 12 months. It’s worth bearing in mind that this averaging can be misleading if your client’s product is seasonal. Wooly hats may have a search volume of 5000 but you can bet that for July the real figure will be significantly lower than Google’s provided average. Keyword planner is luckily kind enough to provide seasonal search volume data. When you’re exporting your CSV, tick the option to include seasonal data. Even if you’re just a wizard level 2 on Excel you should be able to knock up a little trends comparison graph with drop down menus like this one : 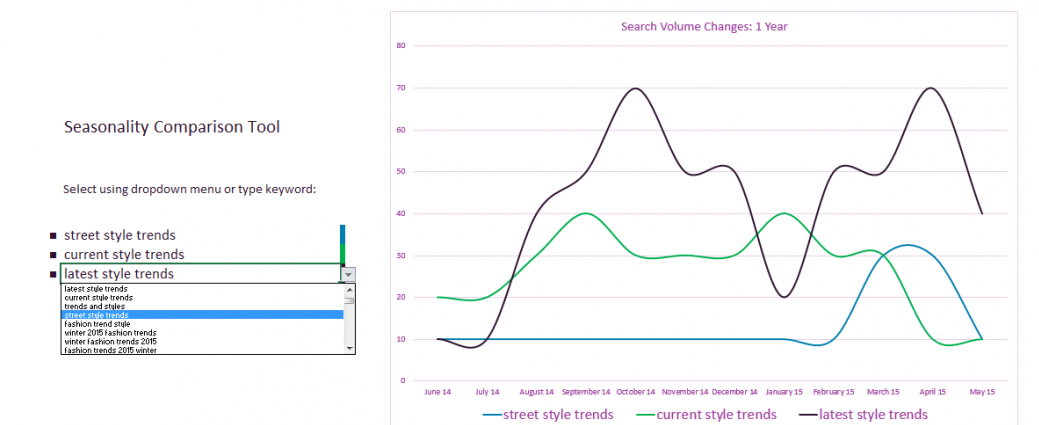
Now your client can look at seasonal trends for different keywords at once and choose which ones they want to go for at different times of the year.
3. How much are people paying to appear for this keyword?
If people are paying loads of money to appear for a keyword, it is either well known to make money, or people with a lot of money think it will make them money. These are good reasons for giving a keyword extra attention in your organic campaign.

Can you rank for this keyword? Someone does. And they’re knee deep in doubloons.
4. Where does the client’s website currently stand in organic search?
Most clients already know whether they’re getting a lot of organic traffic or not, but they usually don’t have a summary view of their rankings for keywords relevant to them across the board. So why not give them one – a simple chart showing the position spread can be really insightful. Each segment of the chart corresponds to a different mutually exclusive group of positions in Google’s search results e.g. #1, 2-5, 6-10 etc. A pie chart should do the trick nicely – some people go for bars, it’s a matter of personal taste. A pivot table and a couple of countifs later and you’ve got a bird’s eye view.
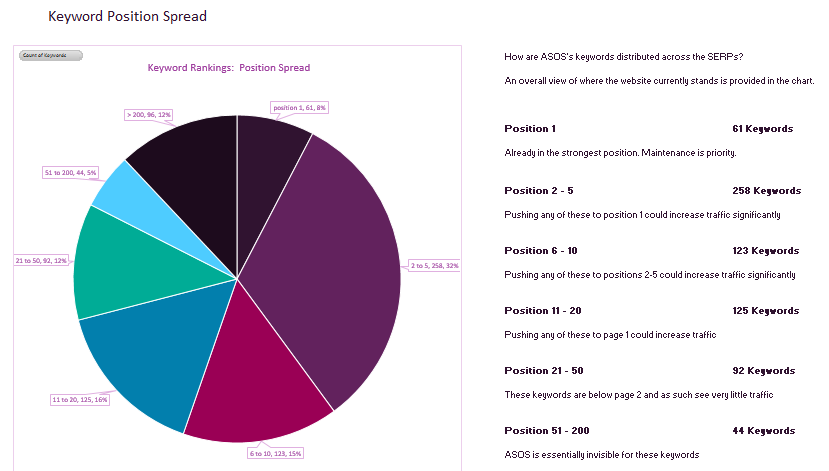
Now the client can say to their CEO “this is where we are in organic” and look righteous in the process.
5. Which pages rank for which terms?
Most rank tracking tools are kind enough to tell you the page on the client’s website which is ranking for a keyword, not just the position. This data is simple to add into your main keyword table and adds a whole new dimension of insight. Add some columns, fire up the lockups and you’re ready to hit the town. If your client’s “contact us” page is outranking their homepage for their primary terms, you’ll find out about it by doing this. Then you can ask them to change the title on the homepage from “Home” to “Trouser Presses | Corby”.
6. How much traffic is the client getting from organic search on each term?
Landing page reports in Google Analytics can give a hint as to which pages are doing well but since ‘not provided’ there is little indication as to whether the organic traffic to a successful page is coming from one big keyword or a host of smaller keywords. Including ranking data in your keyword analysis document gives you a clue to this mystery. Combining ranking data with search volume and average click through rates by organic position, you can make a damn good guess at the amount of organic traffic which is being received per keyword. It’s not as good as the old stuff but it still packs a punch.
7. How much is a single organic visit worth to the client?
When you know the value of an organic visit, your search volume and ranking data take on a whole new meaning. Suddenly, you can put a tangible currency value on your SEO data. Now your research speaks the language most comprehensible to your client: £££
Per session value
The “Per Session Value”, also referred to as EPV (earnings per visit), is available in Google Analytics provided your client has eCommerce tracking set up. After segmenting for organic traffic and setting the date range to the last 12 months. 1: Behaviour -> Landing Pages 2: Select “eCommerce” from the explorer tab 3: The average Per Session Value is shown in the right-most column. Now, if you know how many organic visits the client’s website may receive for a certain keyword at a certain position, you can use the per session value to place a monetary value on that keyword depending on position. The per-session value can vary between groups of products and services, so for maximum accuracy, it’s best to look at each keyword portfolio group in turn.
8. How much traffic and revenue could be gained from a top 5 position?
As a hot shot SEO, you’re confident you can get your client’s website performing better than it currently does in organic search. The exact form this will take, however, is less certain. Google haven’t yet shared the full details of their algorithm and your spies on the inside have yet to deliver the crucial intelligence needed to finally crack the code. The exact SERP positions cannot be predicted. This can make assigning organic keyword value difficult because organic traffic (and revenue) varies significantly between positions in the top 5. Is there another way? Sort of…
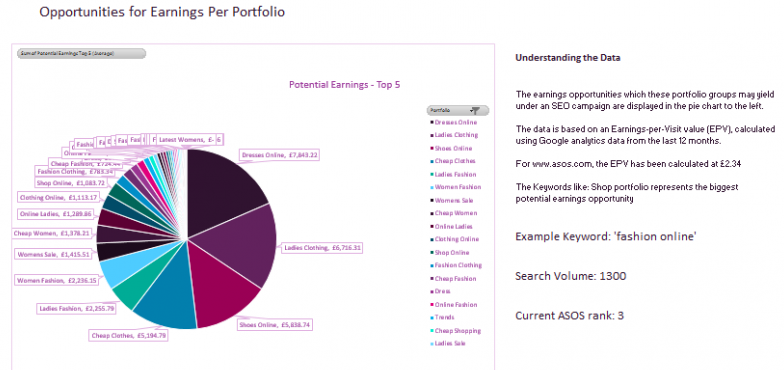
Potential traffic & revenue by portfolio: Top 5
Averaging the traffic to be obtained for a keyword across the top 5 may be the answer you’re looking for – it’s a way of getting a broad impression of the rewards of ranking in the top 5 without knowing which particular rank the client’s website will achieve. When all the keywords for which the client site ranks below position 5 are given this treatment, combined with the Per Session Value data explained in the point above, you’ll have a series of monetary values for the keywords which can be prioritised in order of potential top 5 revenue. Viewing this data at the portfolio level (i.e. sum of top 5 potential revenue for all keywords in a portfolio) is even more powerful because it shows clearly which business areas your campaign will profit most from focusing on.
9. Which keywords can deliver the quickest wins?
You’ve made your top 5 revenue pie charts and now your keyword analysis document looks like it’s from the 26th century. When your client says “which areas should we target?”, you can say “our data suggests that targeting the ‘trouser presses’ portfolio group will yield the greatest potential top 5 revenue”. “Ok” says the client, visibly impressed but wanting more. “Which particular keywords should we target first?”
Opportunity keywords
Opportunity keywords deliver the quickest wins for the client. There are many possibilities for identifying these. Two of my favourites are:
- Cusp of Page 1 (positions 11-13)
- Cusp of Top 5 (positions 6-8)
Keywords in these position brackets stand to receive an increase in organic traffic and / or organic impressions from relatively small increases in rank. If you can list all the keywords meeting this criteria for the client’s website and order them by search volume, you’re one step away from creating opportunity keyword scatter graphs like the one pictured below. All you need to do first is check that the keywords which you’re looking at actually have commercial value.
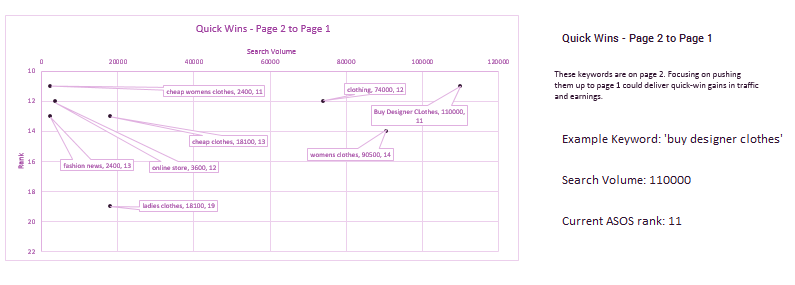
Client: “Which particular keywords should we target first?” You: *Points at graph showing a wealth of information*
10. Why have I paid money for you to make this?
This is what will run through some clients’ minds when they finish reading your magnum opus. To you, it’s clear that the keyword at the top-right of the cusp of top 5 opportunity scatter graph is the one which should be optimised for first. You even wrote “top right = higher SEO potential” next to it so even a 5 year old could understand it. Problem is, your client makes trouser presses and hadn’t heard of SEO until last Wednesday.

In SEO, I find it’s easy to forget that things which seem obvious to me are only obvious because I’ve been doing this for years. Some clients, being human, won’t want to admit to not understanding (who likes doing that?) so instead of asking for clarification, they might close off and keep asking “so what do we do?” when, to your SEO brain, that is clear from the document.
Write a tailored summary
Have an idea of the client’s level of understanding and technical interest before sending the document over to them. Write a summary tailored to fit them – the better they understand your findings, the easier it will be for both clients and SEOs to make progress together. When the real work of SEO optimisation begins, the tables, graphs and statistics in your Keyword Analysis Document will be there to back up every action.
Found is a London-based multi-award-winning digital growth, SEO, PPC, Social and Digital PR agency that harnesses the efficiencies of data and technology and future-thinking to help clients grow their businesses online.
Download our latest white paper
PERSONALISATION:
FUTURE-PROOFING YOUR ECOMMERCE STRATEGY.